 |
| NPHS 1510: Federal and International |
| Geographic Information Systems (GIS) |
|
| |
| GIS Applications in Emergency Analysis and Decision Making |
| |
| It would be impossible to cover all of the possible applications of GIS in emergency analysis and decision making. The purpose of this section is to give the student an appreciation of the breadth and depth of GIS emergency applications. Through selected examples we hope to stimulate thinking on the types of geospatial information and display useful for emergency planning, response and recovery. |
| |
| Jurisdiction Mapping |
| |
| Definition: |
Jurisdiction: A range or sphere of authority. Public agencies have jurisdiction at an incident related to their legal responsibilities and authority. Jurisdictional authority at an incident can be political or geographical (e.g., Federal, State, tribal, and local boundary lines) or functional (e.g., law enforcement, public health).
Source:
National Response Framework Resource Center
|
|
| |
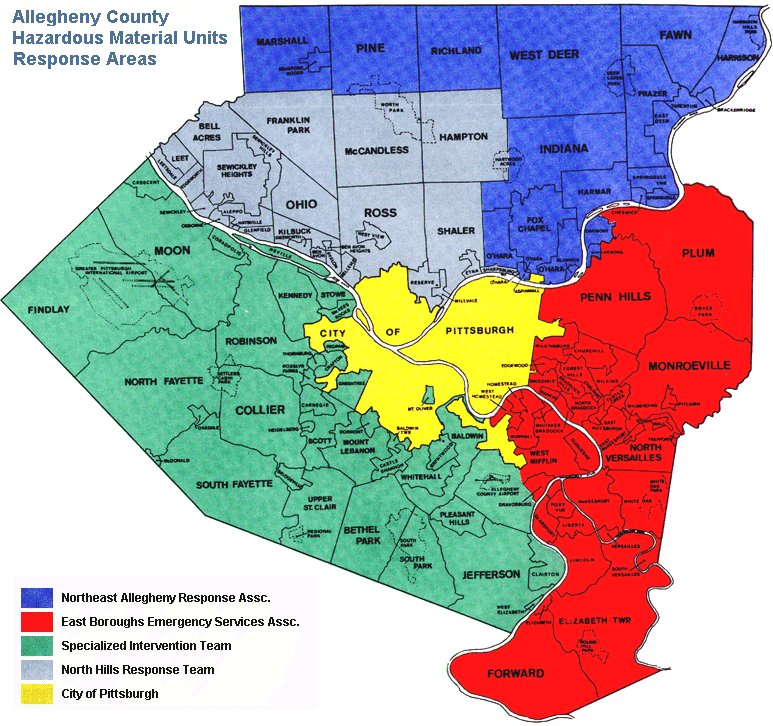
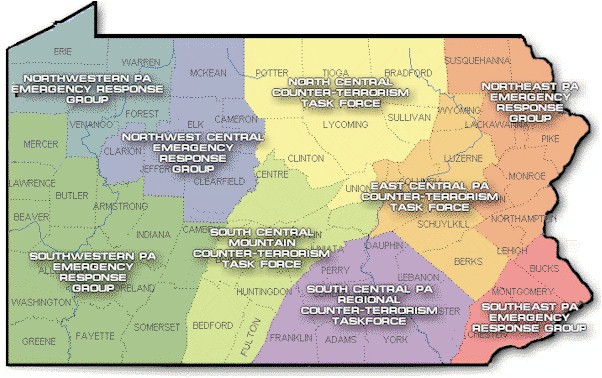
Perhaps the primary use for GIS in the emergeency domain is jurisdiction mapping. Maps of jurisdictions and their boundaries help emergency decision makers among other things:
- Allocate funding and resources.
- Determine who is in command.
- Determine who will respond.
- Identify mutual aid partners.
- Define planning regions.
- Plan training areas and tasks.
- Assess damage.
The maps below show some typical jurisdictional maps.
|
| |
 |
| |
| |
 |
| |
| |
| Hazard Mapping |
| |
|
| |
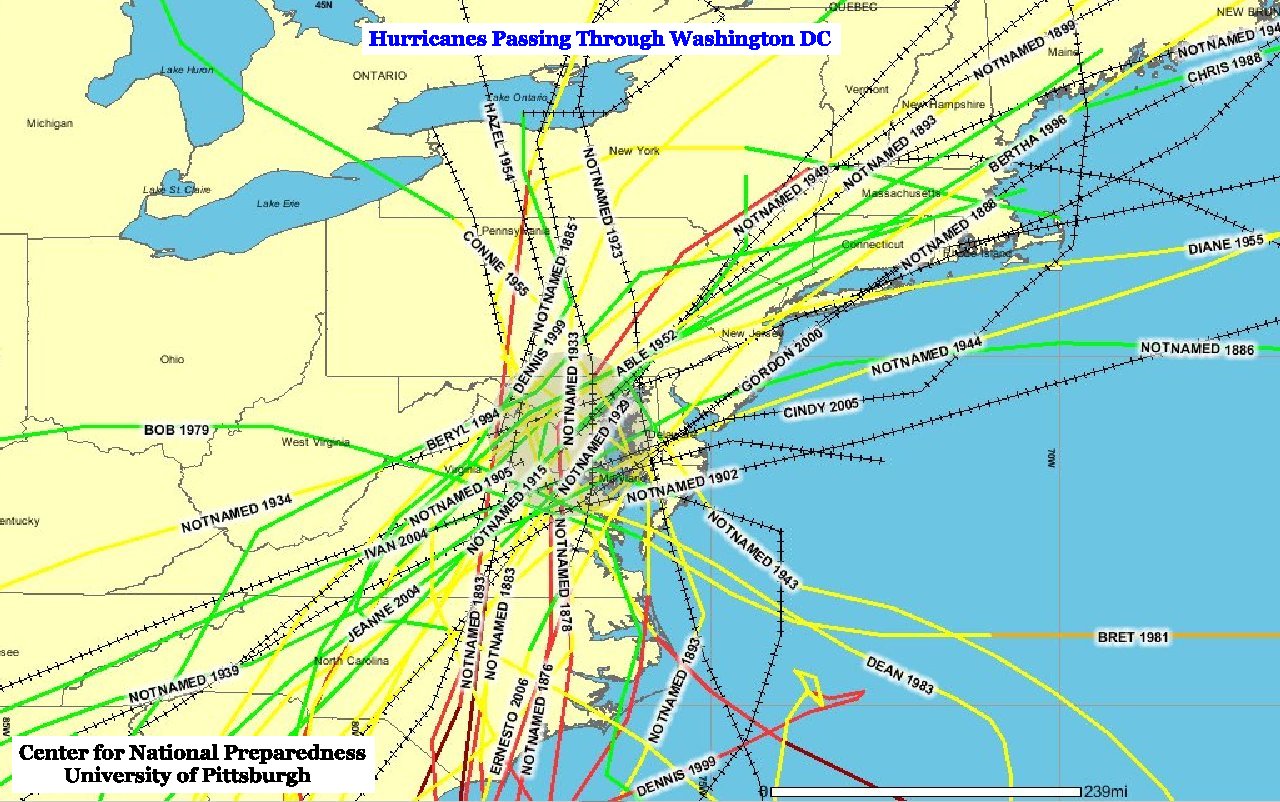
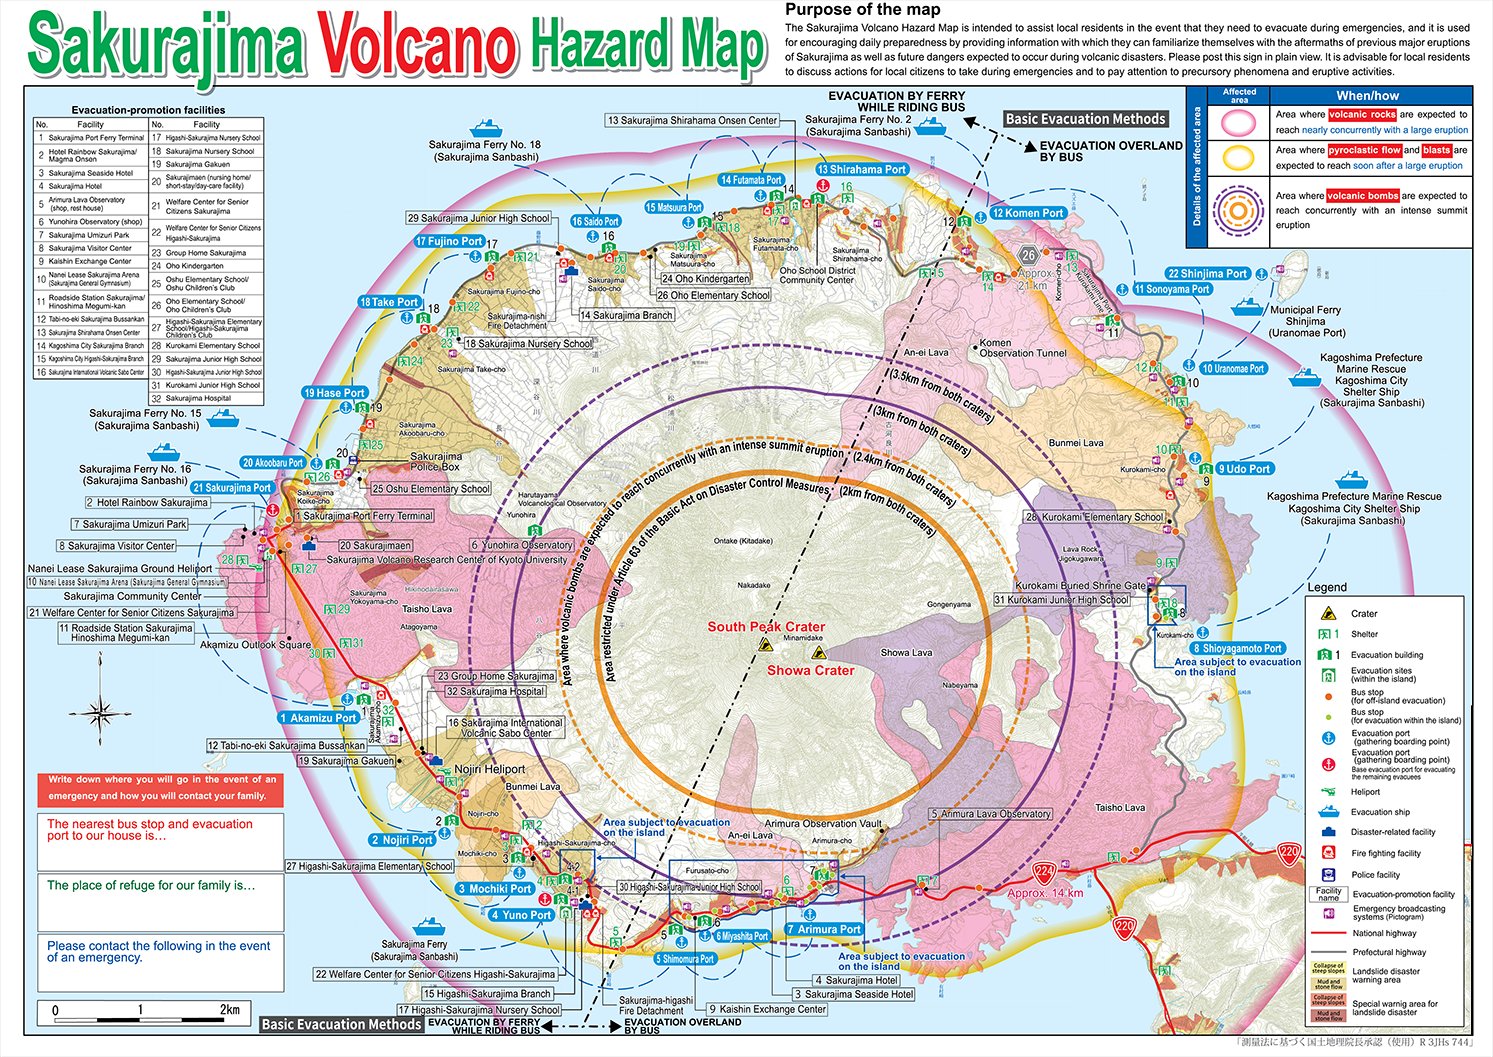
Hazard Maps show where natural or man-made events are likely to occur. Hazard maps can help emergency decision makers.
- Preposition emergency response and recovery resources.
- Predict damage.
- Determine evacuation areas, routes and destinations.
- Identify potential responders.
The map below shows a hurricane hazard map for washington, DC.. |
| |
 |
| |
| The next map shows ths hazardous areas around the Sakurajima Volcano in Japan. Sourse: World Road Association (PIARC.org). |
| |
 |
| |
| |
| Critical Infrastructure Mapping |
| |
| Definition: |
Critical Infrastructure: Systems, assets, and networks, whether physical or virtual, so vital to the United States that the incapacity or destruction of such systems and assets would have a debilitating impact on security, national economic security, national public health or safety, or any combination of those matters.
Source:
National Response Framework Resource Center
|
|
| |
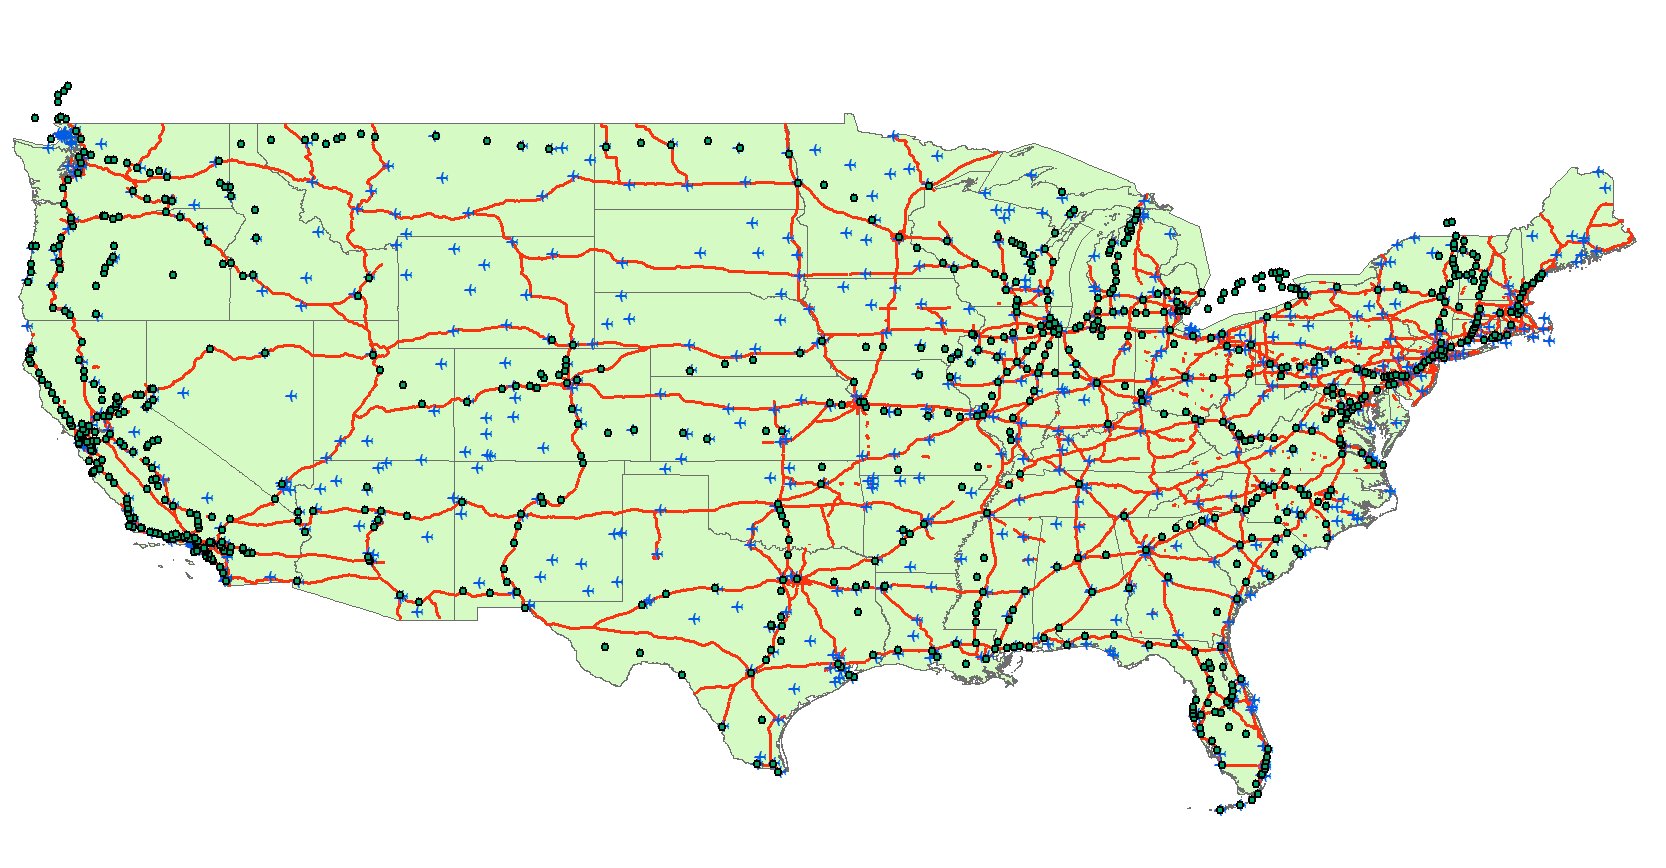
Critical infrastructure are those elements of a community's assets that are essential to that community functioning. Critical infrastructure maps can assist emergeency decision makerss in:
- Locating critical infrastructure.
- Identifying co-location of infrastructure.
- Determining protection requirements and plans.
- Identifying interdependencies in infrastructure elements.
The map below shows the locations of the highway, rail and air subsectors of the Transportation sector. Note how issues of co-location and interdependencies become evident.
|
| |
 |
| |
| |
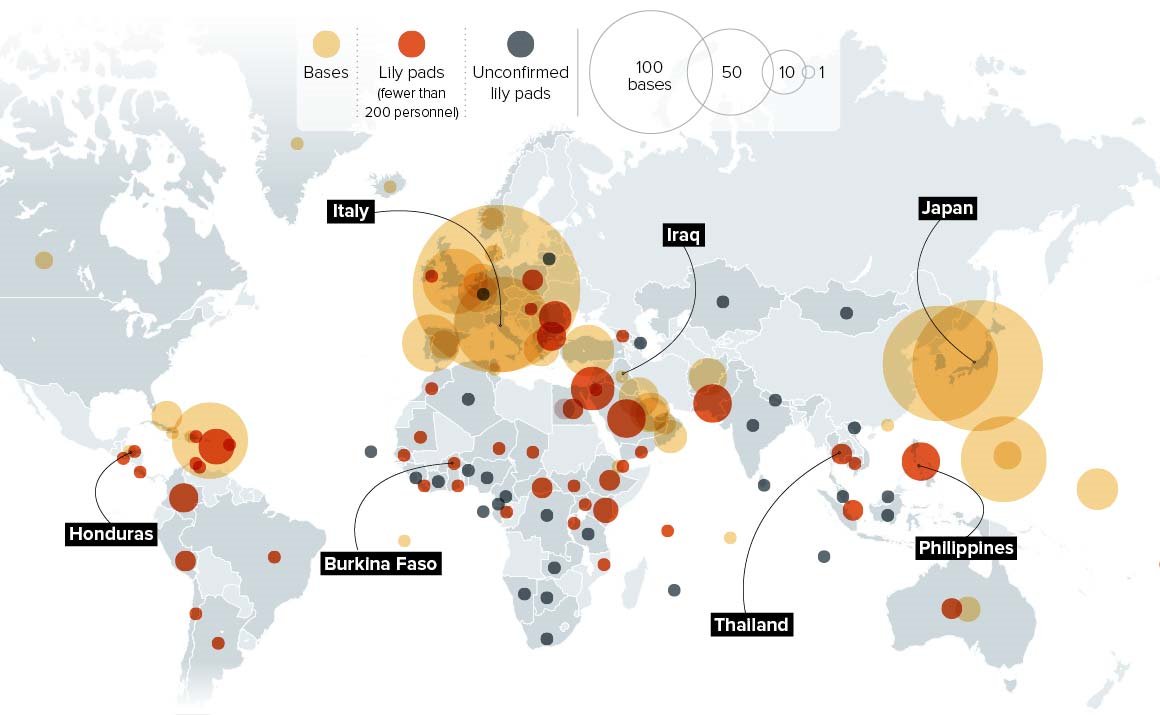
| The next map give the location, type and size of US Military bases throughout the world. |
| |
 |
| |
The Pennsylvania Technology Atlas
The Technology Atlas, the first of its kind, resulted from the efforts of the Documentation of Resources and Technology Transfer Project, which was one of the main projects in Pennsylvania's Link-to-Learn Initiative.
The Documentation of Resources and Technology Transfer Project assesses what technologies and technological needs exist in the Commonwealth of Pennsylvania.
This information is utilized to create a networked learning environment which can benefit all the citizens of the Commonwealth and related organizational entities that provide education, social, economic, health and safety benefits and opportunities.
|
The Pennsylvania Technology Atlas
The Technology Atlas seeks to document what technological resources currently exist and how they can be utilized to build a statewide technological infrastructure to permit Pennsylvania, its citizens as well as its education, business, social and governmental organizations to compete on a national and international basis in the twenty-first (21st) century.
Under a contract from the Commonwealth of Pennsylvania, Ken's group at the University of Pittsburgh identified, surveyed, catalogued and mapped the tecnology infrastructure assets of 50,000 organizations across the Commonwealth.
Categories of organizations include:
- Business Organizations
- Educational Sites
- Government Organizations
- IUs
- Libraries
- Medical Organizations
- R&D, Promotion Organizations
- Schools
- School Districts
- Telecommunications Organizations
- Utilities
Examples of technological infrastructure assets:
- Wide Area Networks
- Satellite Facilities
- Microwave Facilities
- Videoconferencing Facilities
- Distance Education Facilities
- Training Facilities
- Fiber Optics
Each year the data and maps were compiled and produced in atlases with accompanying CDs. |
|
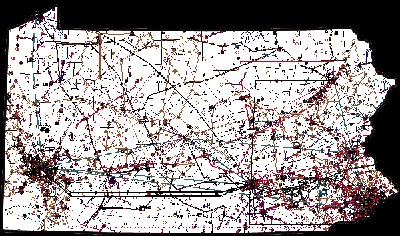
Composite Map of Pennsylvania Technology Assets |
|
The Atlas received many awards. It was catalogued by the Harvard Map Project (library.harvard.edu/libraries/harvard-map-collection ) and was Wired Magazines www.wired.com) website of the month. |
| |
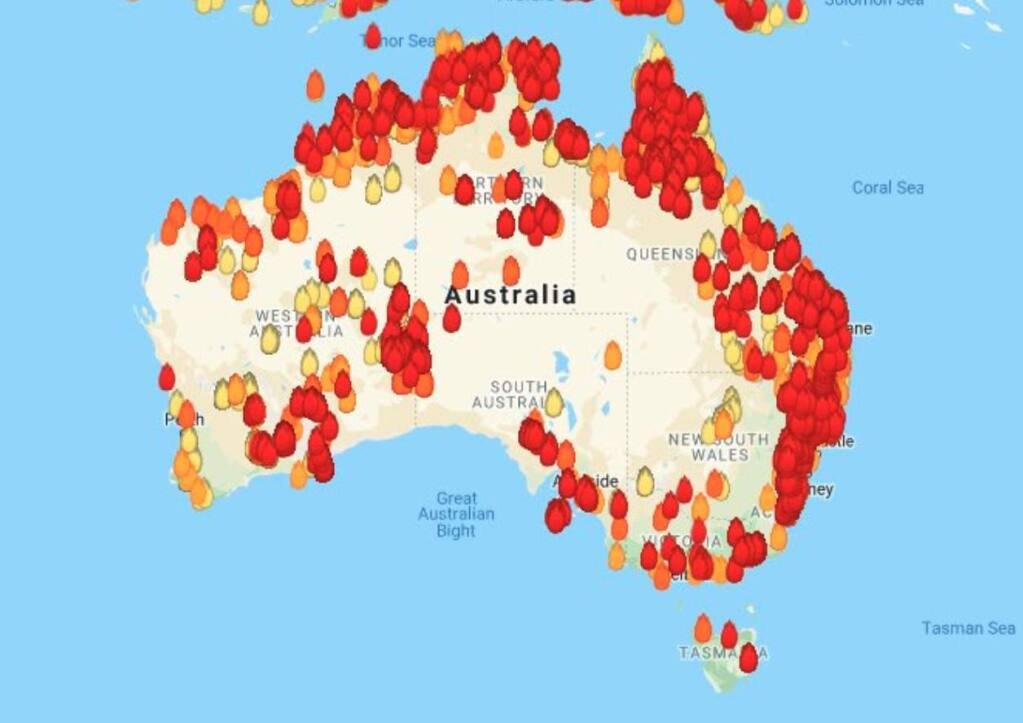
| Event Mapping |
| |
| The next map depicts the location and relative size of the Austrailian wildfires of 2019. Much infrastructure was burnt and millions of animals perished. (the Press Democrat). |
| |
| |
 |
| |
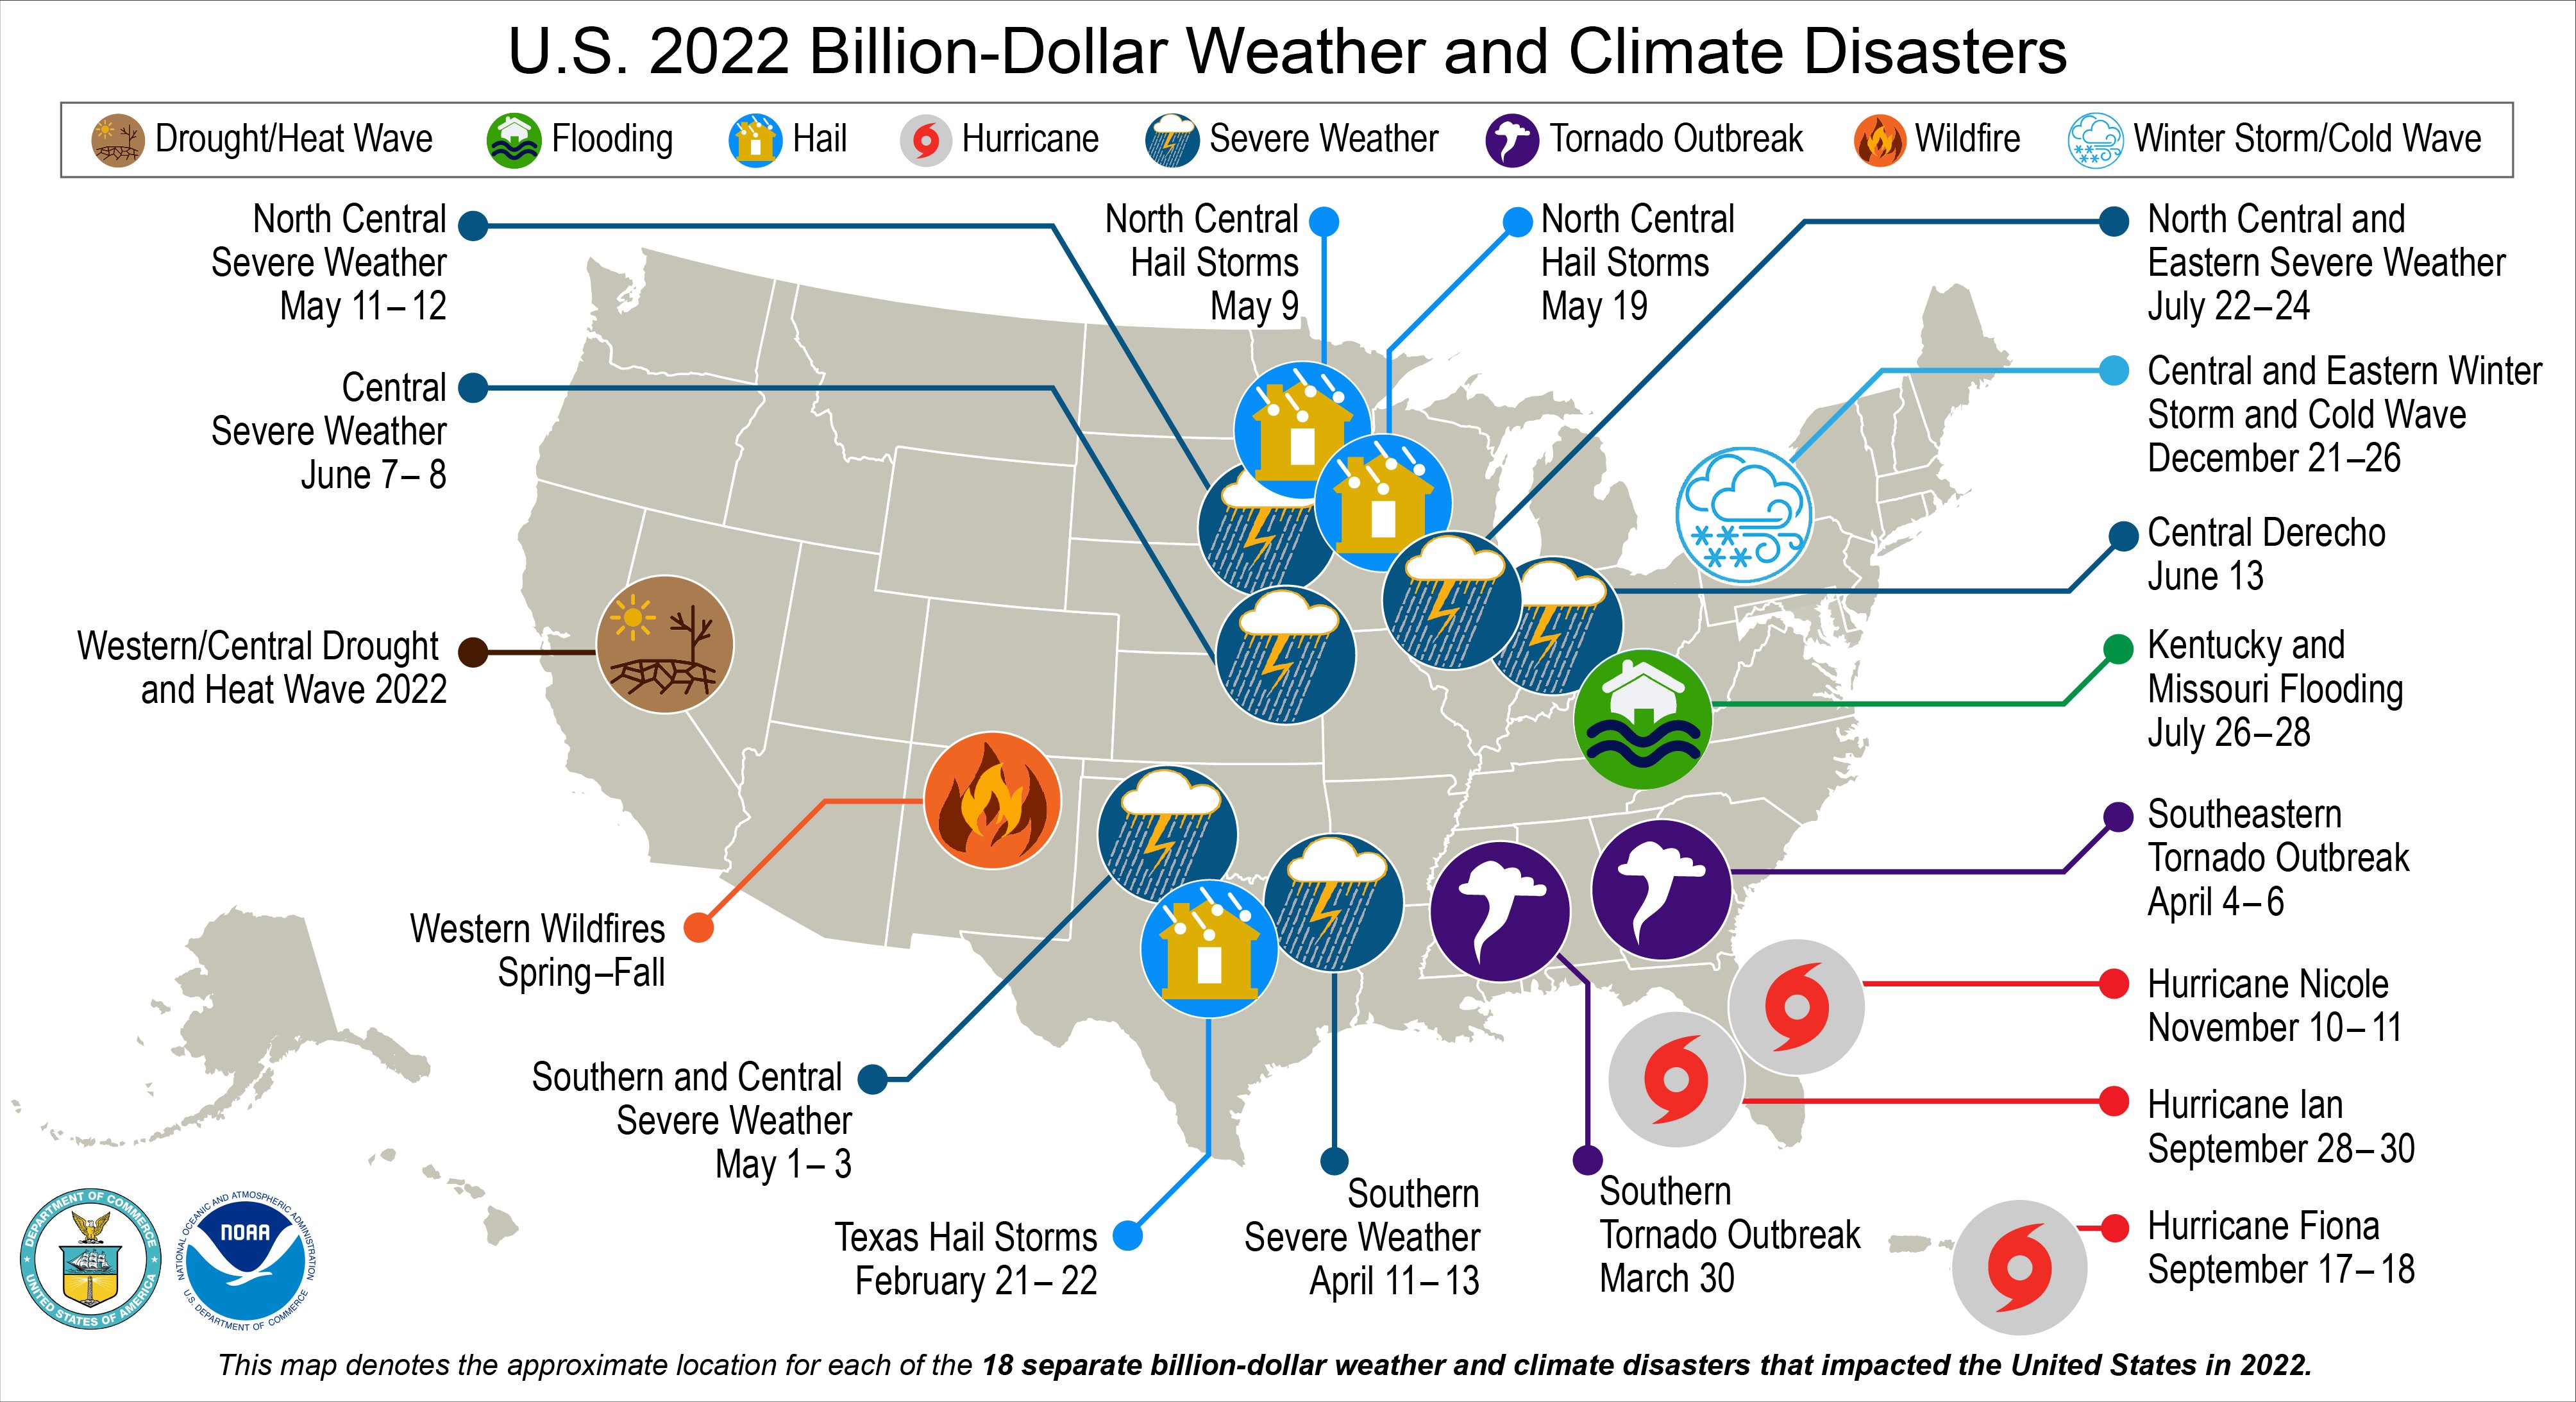
| Climate.gov produced the following map. It shows the 2022 major climate and weather disasters, their location and date. |
| |
 |
| |
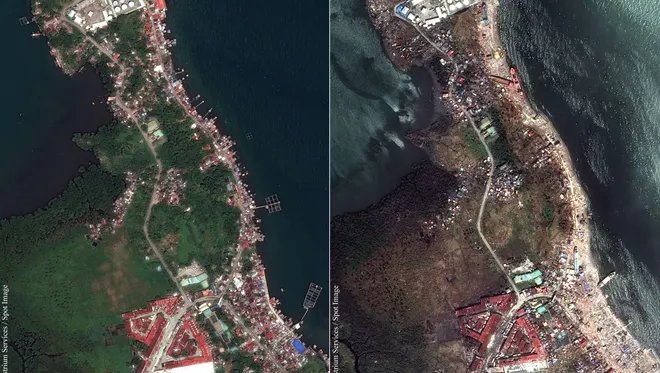
| Damage Assessment |
| |
| Before and after maps are useful in assessing the damage that occurs in a major event. The maps below (Getty Images) depicts the damage caused by the Tacloban Typhoon in the Phillipines. |
| |
 |
| |
| |
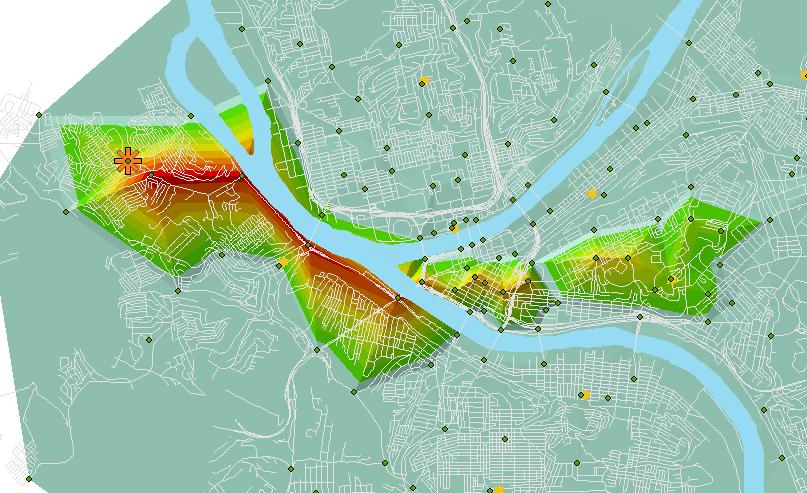
| Emergency Modeling and Simulation Mapping |
| |
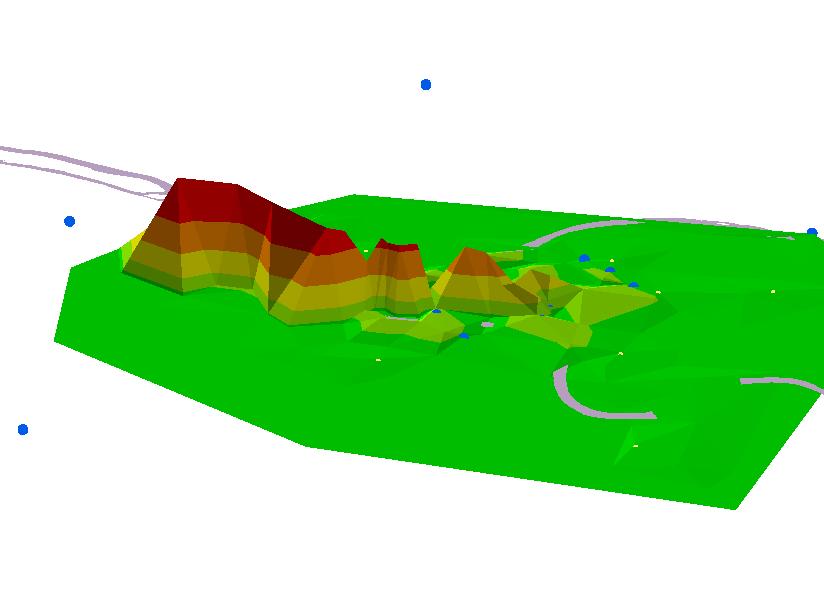
| Emergency events are dynamic. It is crrucial that we develop models and simulations to predict the progress of the event and its impact on the region affected. Maps are useful mechanisms to effectively and efficiently display the results of these models and simulations. The two maps below show traffic congestion resulting from the simulation of an improvised explosive devicee in Pittsburgh using the Dynamic Discrete Disaster Decision Support System (D4S2). |
| |
 |
| |
 |
| |
| The map below shows the result of a 24 hour simulation of the potential spread of a pandemic in the United States via the air transportation system assuming the virus arriving via international flights from Europe. |
| |
 |
| |
| |
| Historical Mapping |
| |
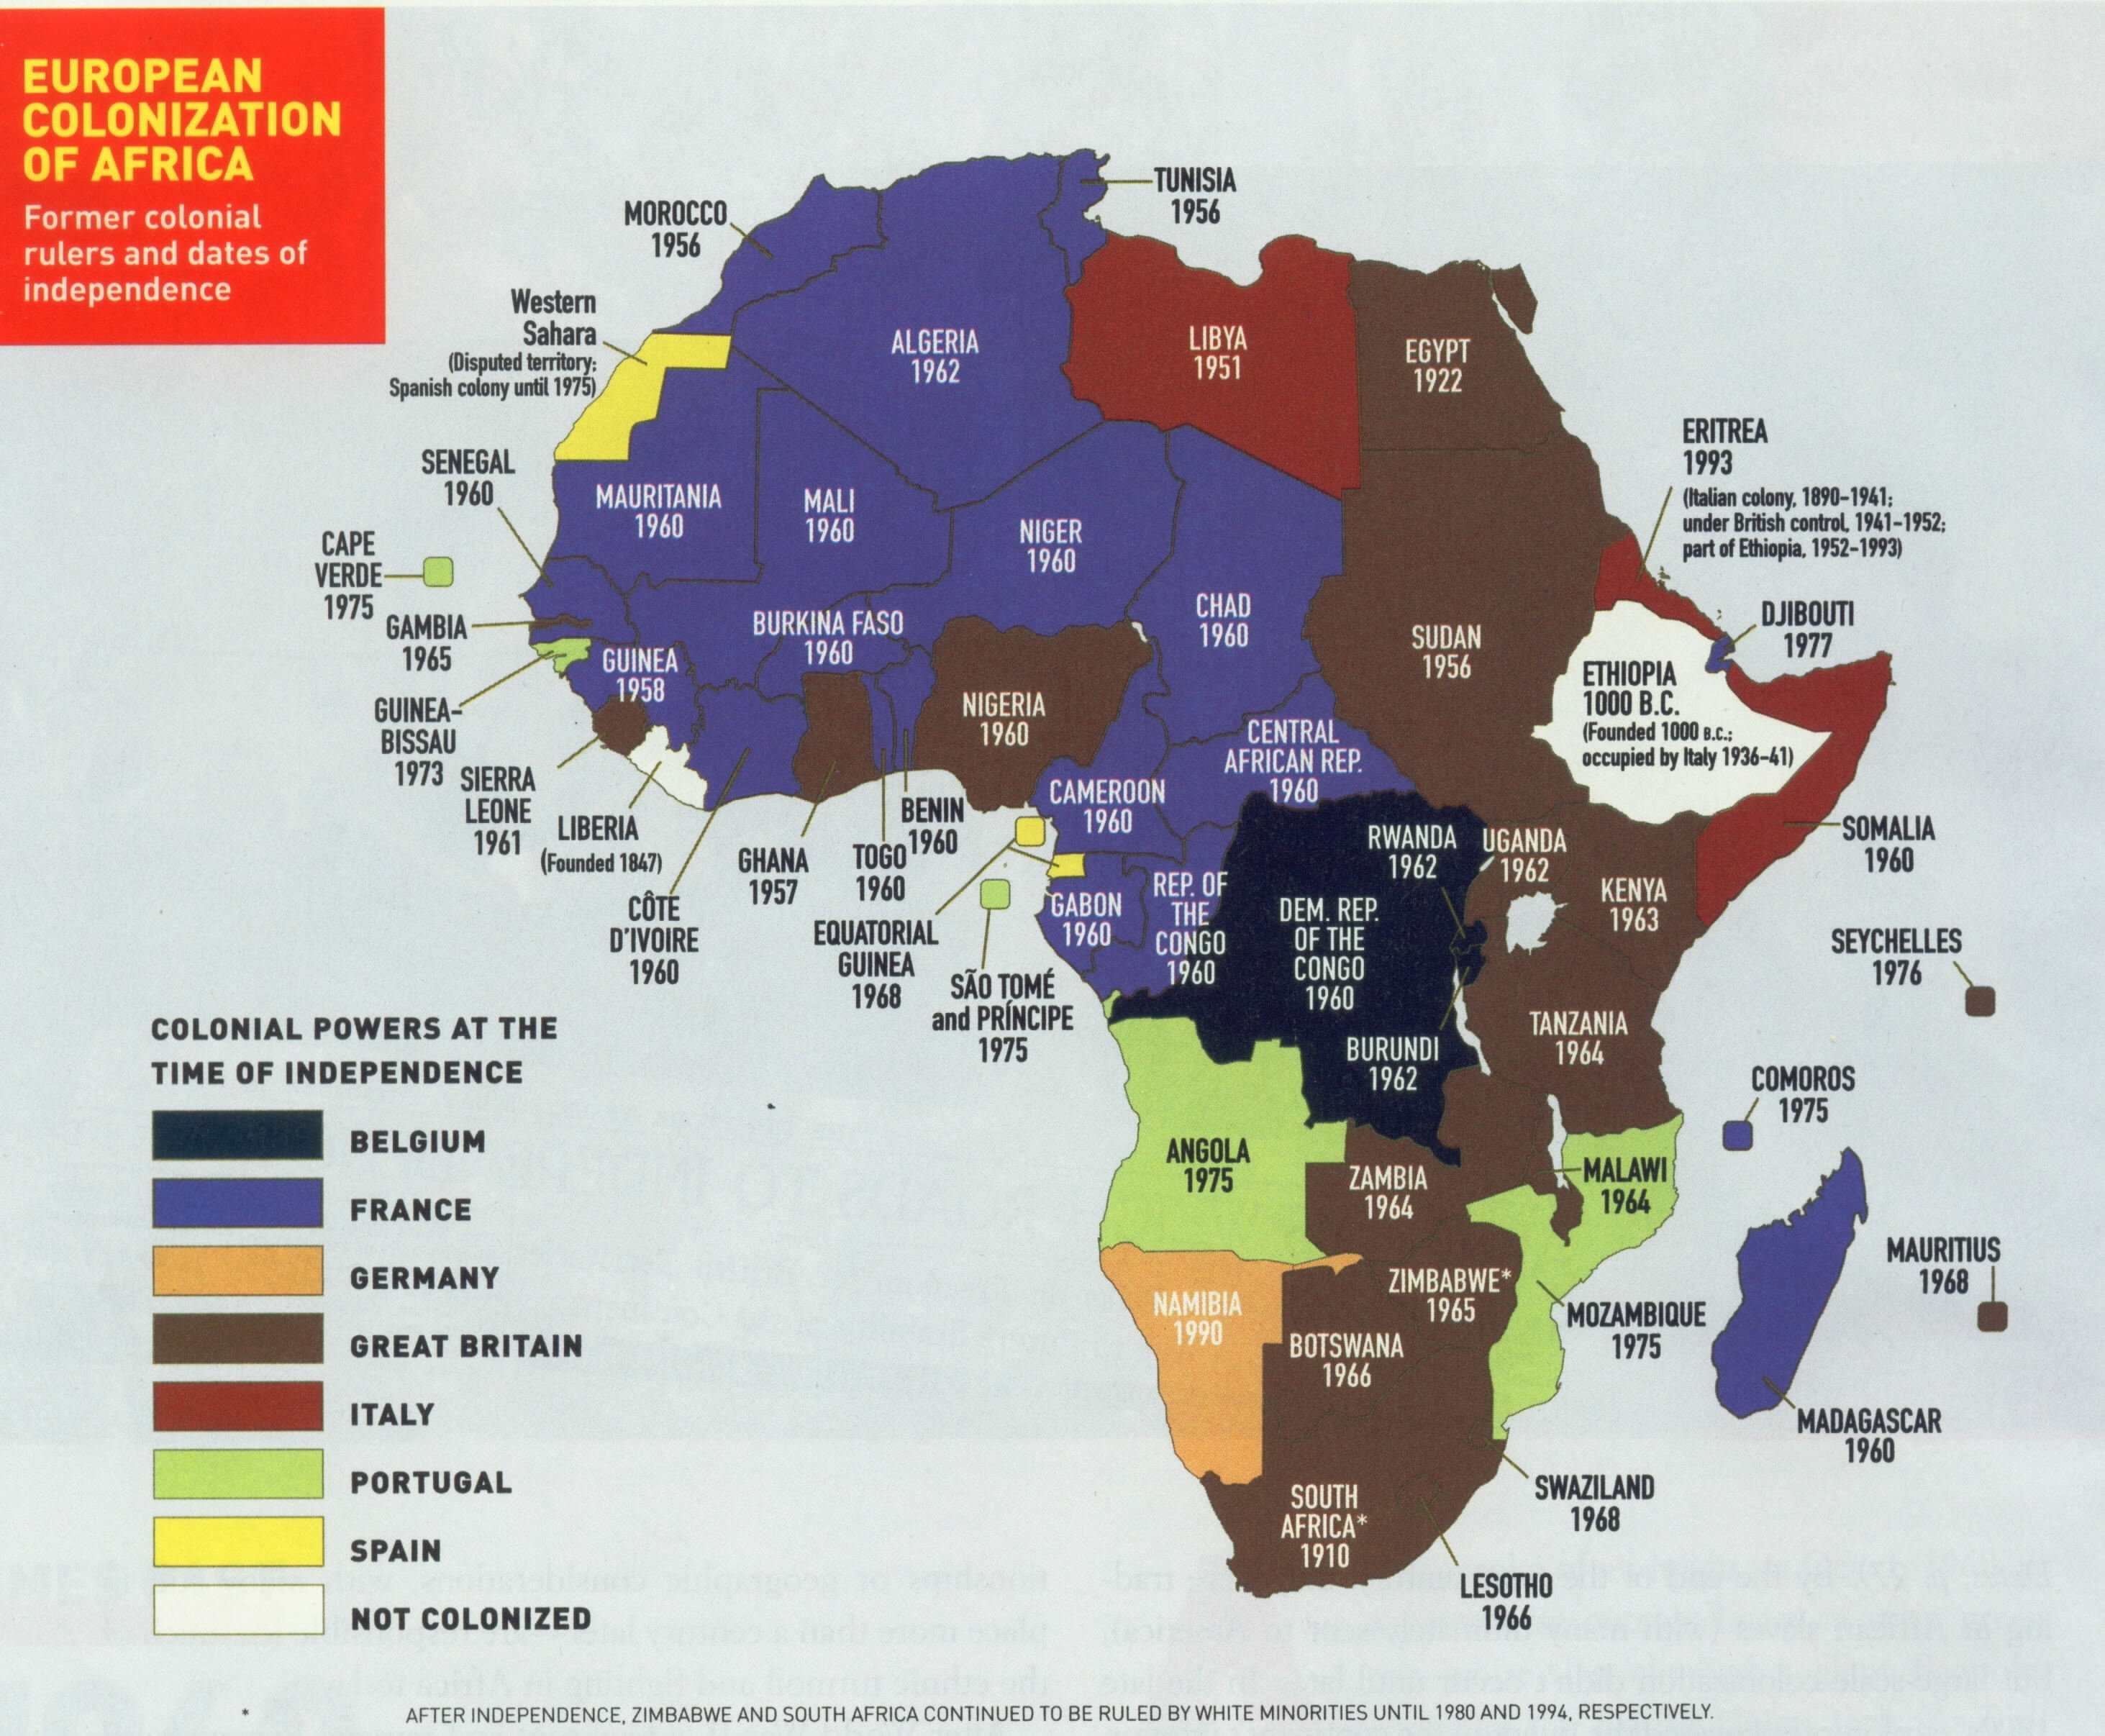
| The map below shows the countries of Africa and the European Countries that colonized them along with the dates of their indepenc=dence (www.missmeller.com). |
 |
| |
| Resources: |
"Embedding GIS in Disaster Simulation", Shengnan Wu, Larry Shuman, Bopaya Bidanda, Matthew Kelley, Ken Sochats and Carey Balaban, ESRI International Users Conference, San Diego, June 18-22, 2007.
"Pittsburgh's Role in National Emergency Preparedness", Leigh McIntosh and Ken Sochats, Pittsburgh Economic Quarterly, March, 2010.
|
|
| |
| Exercise: |
Identify other possible appications of GIS to emergency decision making. Download new shapefiles. Create a map that illustrates one of these applications. |
|
| |
|
|
|
|
| Copyright © 2011 - 2024 Ken Sochats |