 | |||||||||||||||||||||||||||
| NPHS 1530: Analytics | |||||||||||||||||||||||||||
| Reliability | |||||||||||||||||||||||||||


| |||||||||||||||||||||||||||
   | |||||||||||||||||||||||||||
|
Parallel System Reliability The figure below shows a simple system with two parallel components. 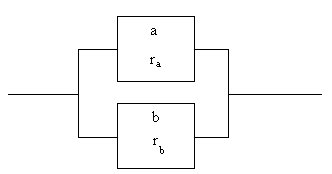
In a purely parallel system, the system operates if any one of the parallel components is operating. The system is down only if all of the components have failed. This, of course, assumes that:
or, calculating the failure probability: If we extrapolate this finding to multiple parallel component systems as we did for series systems, we get: For equal component reliabilities (r) we get: An example two component parallel system is shown in the figure below. One component has a reliability of .9 and the other component has a reliability of .8. The system reliability is: R = 1 - ( 1 - .9 ) * ( 1 - .8 ) R = 1 - .1 * .2 R = .98 An Example Two Component Parallel System 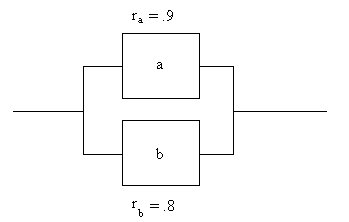
|
|||||||||||||||||||||||||||
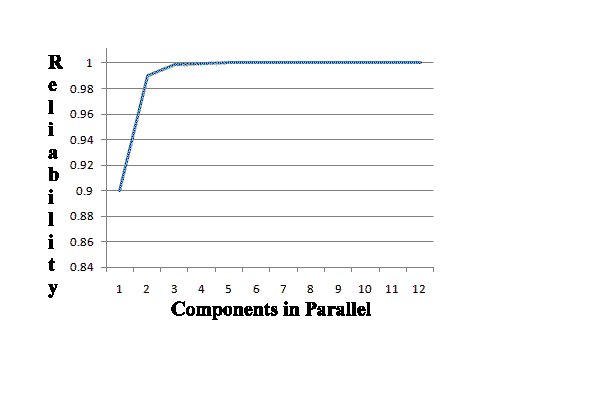
| The table and chart below demonstrate how the addition of components in parallel increases the system reliability. | |||||||||||||||||||||||||||
| |||||||||||||||||||||||||||
 | |||||||||||||||||||||||||||
|
As we will show later, these heuristics are very helpful to the emergency manager in the early planning stages of a design. It is often important for a designer to assess a general level of reliability for a system or portion thereof on a relatively quick basis. In addition, these heuristics will give the designer a "feel" for how the design and design alternatives will behave without having to resort to complex and
laborious calculations. |
|||||||||||||||||||||||||||
| Aircraft Engines Example - Parallel | |||||||||||||||||||||||||||
| Developments in aircraft engine power. economy, and reliability have
allowed apirplanes to be built with fewer engines. Early large passenger
airplanes were built with four engines. More modern airplanes are built with
two engines. In order for this to be accomplished, the reliability of a two engine
configuration must be equal to a four engine system
R2 == R4 where R2 = 1-(1-r2)(1-r2) and R4 = 1-(1-r4)(1-r4)(1-r4)(1-r4) For example, if r4 = .9 R4 = .9999 For R2 = .9999 r2=.99 | |||||||||||||||||||||||||||
| Covid-19 Example - Parallel | |||||||||||||||||||||||||||
| As measures against Covid-19 the CDC recommends that the public get a vaccine shot(s), wear a mask and practice social distancing. | |||||||||||||||||||||||||||
| This means that the effectiveness of these measures act in parallel and the reliability can be expressed as: RC19 = 1 - (1 - rVac)(1 - rMask)(1 - rSocial) | |||||||||||||||||||||||||||
| Current Vaccine effectiveness data:
Covid-19 effect
Historical Vaccine effectiveness data: Flu vaccine effectiveness | |||||||||||||||||||||||||||
| Example | |||||||||||||||||||||||||||
| Continuity of operations is important for many organizations. It is especially important for critical infrastructure businesses and government operations. During an emergency, the maintenance of all the emergency support functions (ESFs) is essential. Many organizations develop continuity of operations plans (COOP) so that the organization can continue to operate during and survive the consequences of a disaster.
| |||||||||||||||||||||||||||
| |||||||||||||||||||||||||||
| We can view aspects of the continuity problem using reliability principles.
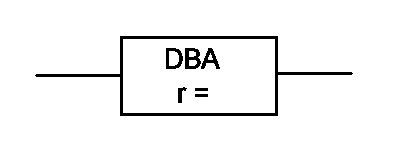
A company has identified the role of a database administrator (DBA) as crucial to the functioning of the buiness. The DBA guarantees the function and credibility of all data operations for the company. Each DBA is essentialy a service module with a reliability. For this analysis we will assume each DBA works a single shift per day with no overtime. We can estimate a reliability for the DBA from work characteristics: vacation, business travel, holidays, sick days, etc. Suppose that a DBA is unavailable for work for 67 days per year. He or she is thus annually available for work for 298 days. In other words we could estimate the DBA's reliability as 298/365 = .816. | |||||||||||||||||||||||||||
 | |||||||||||||||||||||||||||
| The table below shows the calculated system reliability for various numbers of DBAs. | |||||||||||||||||||||||||||
| |||||||||||||||||||||||||||
| The attached spreadsheet contains the DBA model. | |||||||||||||||||||||||||||
| |||||||||||||||||||||||||||
| |||||||||||||||||||||||||||
| Copyright © 2011 - 2022 Ken Sochats | |||||||||||||||||||||||||||


