The diagram below shows a simplified schematic of an electrical power system. Power is generated at an electric power station of a number of types (fossil, nuclear, hydroelectric, solar, etc.). At the plant, step-up transformers convert the electrical power to a very high voltage for transmission. The electrical power flows over transmssion lines to substations and onto distribution lines for delivery to customers. At the substations, the power is again converted to a lower intermediate voltage by step-down transformers for distribution. Located close to the customers are further step-down transformers that convert the power to levels used in our homes and businesses.
The most visible parts of the system are the distribution lines and transformers like the one shown to the right. We have all seen these in our neighborhoods and along the highways. Reliability is a serious concern for the electrical power system. Since all of the components of the system are connected in series to deliver power to you, the failure of a single component along the way can interrupt power for you.
At my home, for example, the power fails once per month on the average. Components like the distribution lines and transformers are out in the open and susceptible to storms, vehicles crashing into poles and other hazards.
Power grids with multiple paths between scource and consumer are one way of improving the reliability of the system.
The Series System Reliability Model
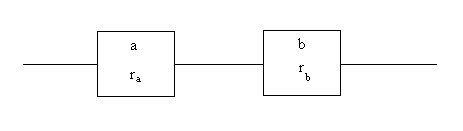
Consider a simple two component system (a, b) with the
components connected in series as shown in the figure below. Assume that the
reliabilities of the components (ra, rb) are testable and
known.
A Two Component Series System
We need to develop the reliability (R) of this system as
a function of the known component reliabilities (ra, rb).
This can be done by examining the possible states that the system can be in.
The table below is a truth table of the status of the system components. We see that
component a can be operating or not operating with probabilities ra
and (l-ra) respectively. Likewise component b has the same possible states with corresponding probabilities rb and (l-rb).
Since the system is a series system, the system operates only when both of the components are operating.
There are two key assumptions involved with this conclusion and the analyses in the following sections.
A component is either failed or operating; there are no partial component malfunctions.
A single component failure does not cause other components to fail. In other words, each component operates independently.
These assumptions of binary behavior and complete independence are essential to our development of a probability model for the reliability of systems.
System Component Statuses and System States
Component
System
a
b
Probability
State
Working
Working
ra * rb
Operating
Working
Failed
ra * (1- rb)
Not Operating
Failed
Working
( 1 - ra) * rb
Not Operating
Failed
Failed
( 1 - ra) * (1 - rb)
Not Operating
From the analysis of the table above, we see that the system is
operating only when both components are functional and the system does not
operate when either of the components is down. If we assume that the statuses of the components are independent, the probability of the system operating, its reliability (R), is the product of the two component reliabilities (ra, rb).
R = ra * rb
Since this is a probability, its complement, the system
failure probability (F), is:
F = 1 - R
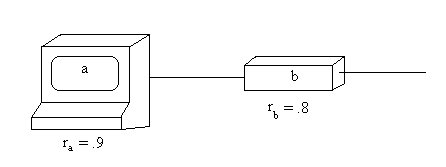
As an example, examine the two component series system shown in Figure 2. The system might represent a terminal and modem configuration. The system component reliabilities for the terminal and modem are .9 and .8 respectively. Using Formula 4 we calculate the system reliability to be R = .72 = .9 * .8. Thus, although the terminal has a reliability of .9 and the modem has a reliability of .8, the series combination has a reliability of only .72.
Figure 2.� An Example Two Component Series System
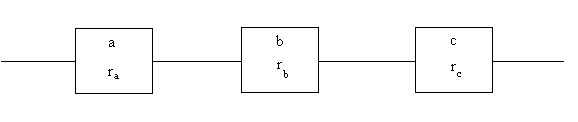
Let us now examine the case with three components (a, b, c) in series. This general system is shown in Figure 3.
Figure 3.� Three Component Series System
A probability state table for this system is given in Table 2. As one can see, in this instance as before in the two component series system, the system reliability is the product of the three component reliabilities (ra, rb, rc). � The only state where the system still functions is when all three components function.
Table 2.� Three Component System Reliability
Component
System
a
b
c
Probability
State
Working
Working
Working
ra * rb * rc
Operating
Working
Working
Failed
ra * rb * (1- rc)
Not Operating
Working
Failed
Working
ra * ( 1 - rb) * rc
Not Operating
Working
Failed
Failed
ra * ( 1 - rb) * ( 1 - rc)
Not Operating
Failed
Working
Working
( 1 - ra) * rb * rc
Not Operating
Failed
Working
Failed
( 1 - ra) * rb * (1 - rc)
Not Operating
Failed
Failed
Failed
( 1 - ra) * (1 - rb) * (1 - rc)
Not Operating
The conclusions arrived at in the above analysis can be
generalized to state that the system reliability for a purely series system is the product of the component reliabilities.
R = ra * rb * rc * . . .
. . rn
If all of the components have the same reliability (r),
this formula simplifies to:
R = rn
By noting that the component reliability must by definition be less than one, we can derive two important design heuristics from the series reliability equation to help the network system designer assess the
reliability of a system design:
Adding series components to a system makes that system less reliable.
R << Rold * rnew
A series system's reliability is less than the
reliability of the system's least reliable component.
R << rmin
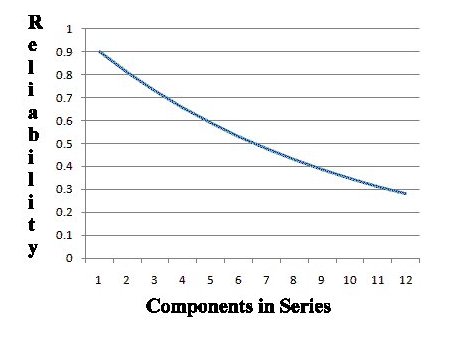
The table and chart below demonstrate how the addition of components in series reduces the system reliability.
Number of Components
Reliability
1
0.9
2
0.81
3
0.729
4
0.6561
5
0.5904
6
0.5314
7
0.4782
8
0.43046
9
0.3874
10
0.3486
11
0.3138
12
0.2824
Exercise:
The attached spreadsheet has two worksheets. The first shows a general series reliability calculation. The second calculates the reliability of a system with n identical components. Alter the reliabilities of the component to explore the effects of component reliability on system Reliability.
As we will show later, these heuristics are very helpful to the emergency manager in the early planning stages of a design.� It is often important for a designer to assess a general level of reliability for a system or portion thereof on a relatively quick basis.� In addition, these heuristics will give the designer a "feel" for how the design and design alternatives will behave without having to resort to complex and
laborious calculations.
Exercise:
Reliability Testing
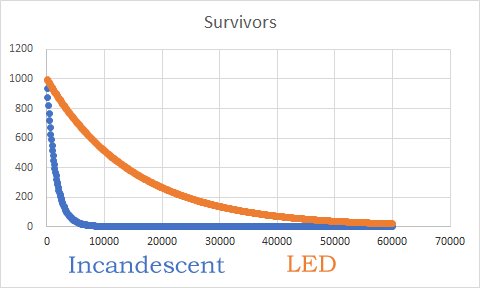
The reliability for components is assessed by testing. A large number of the components is operated in a laboratory and the number of failures is recorded over time. From this data, the mean life μ and thus reliability r = 1/μ is computed. Many common components have their mean lives reported on their packages or instructions.
Consider the case of common household light bulbs. The images below show two types of these light bulbs: incandescent and LED.
Light Bulbs
Incandescent
LED
Incandescent lights have a mean life of 1,500 hours ( rI = .999333 ). LED light bulbs have a mean life of 15,000 hours ( rLED = .999933 ). The graph below shows the resultant number of survivors for a test group of 1,000 bulbs each.