 |
| NPHS 1510: Federal and International |
| National Natural Disasters |
|
| Overview |
| |
The structure of this lesson will follow closely the International Natural Disasters lesson. Our goals are to:
- Learn about the types of disasters affecting us
- Observe patterns of these disasters
- Explore how we respond to these disasters
As we saw with international natural disasters, the impact of the disaster is related to:
- The location of the disaster
- The magnitude of the disaster
- The duration of the disaster
- The geographic spread of the disaster
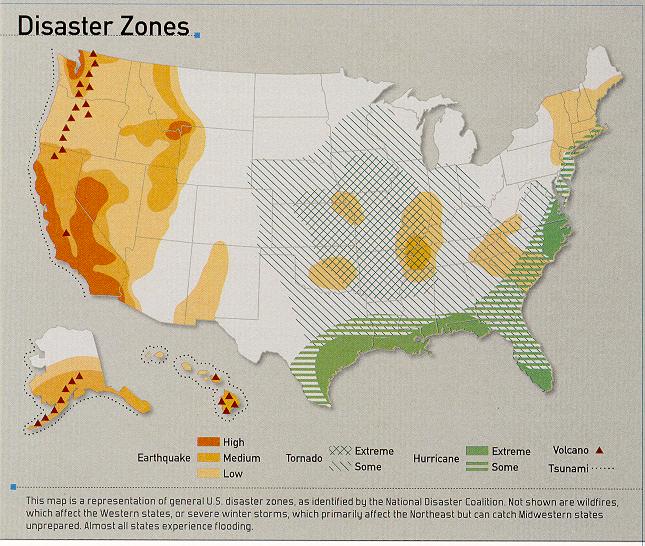
The map below shows the areas where certain types of major natural disasters occur in the United States. Note that not all of the disasters occur everywhere. Also note that we in Pittsburgh live in a relatively safe area. |
| |
 |
| |
| Background |
| |
The two things that make a disaster are that they kill living things (humans, animals and plants) and they destroy property. The map below shows the US population distribution as determined by the 2010 Census. Each dot on the map represents 1000 people. As you can see most of the population is located in the eastern half of the United States and that much of the population is concentrated in coastal areas. In fact over half of the US population is located within fifty miles of a coast.
Compare this map and the following map to the disaster maps that will follow. |
| |
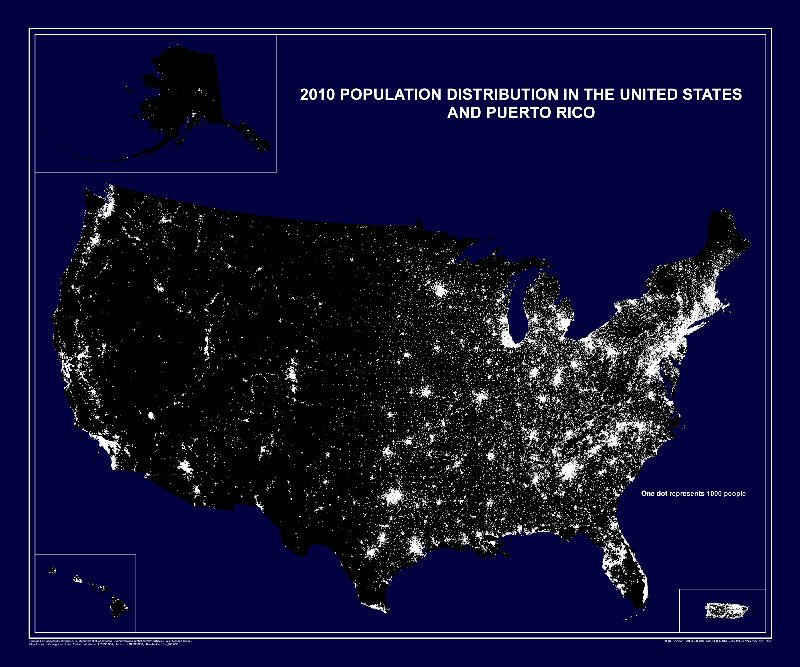 |
| 2010 US Census Population Map |
| |
| The following map shows the Interstate Highway system and the locations of airports and other transportation facilities. As you might expect, these are highly correlated with population. While many disasters do not kill large numbers of people, they tend to do lots of damage to our infrastructure. We can evaacuate people but infrastructure is largely fixed in place. |
| |
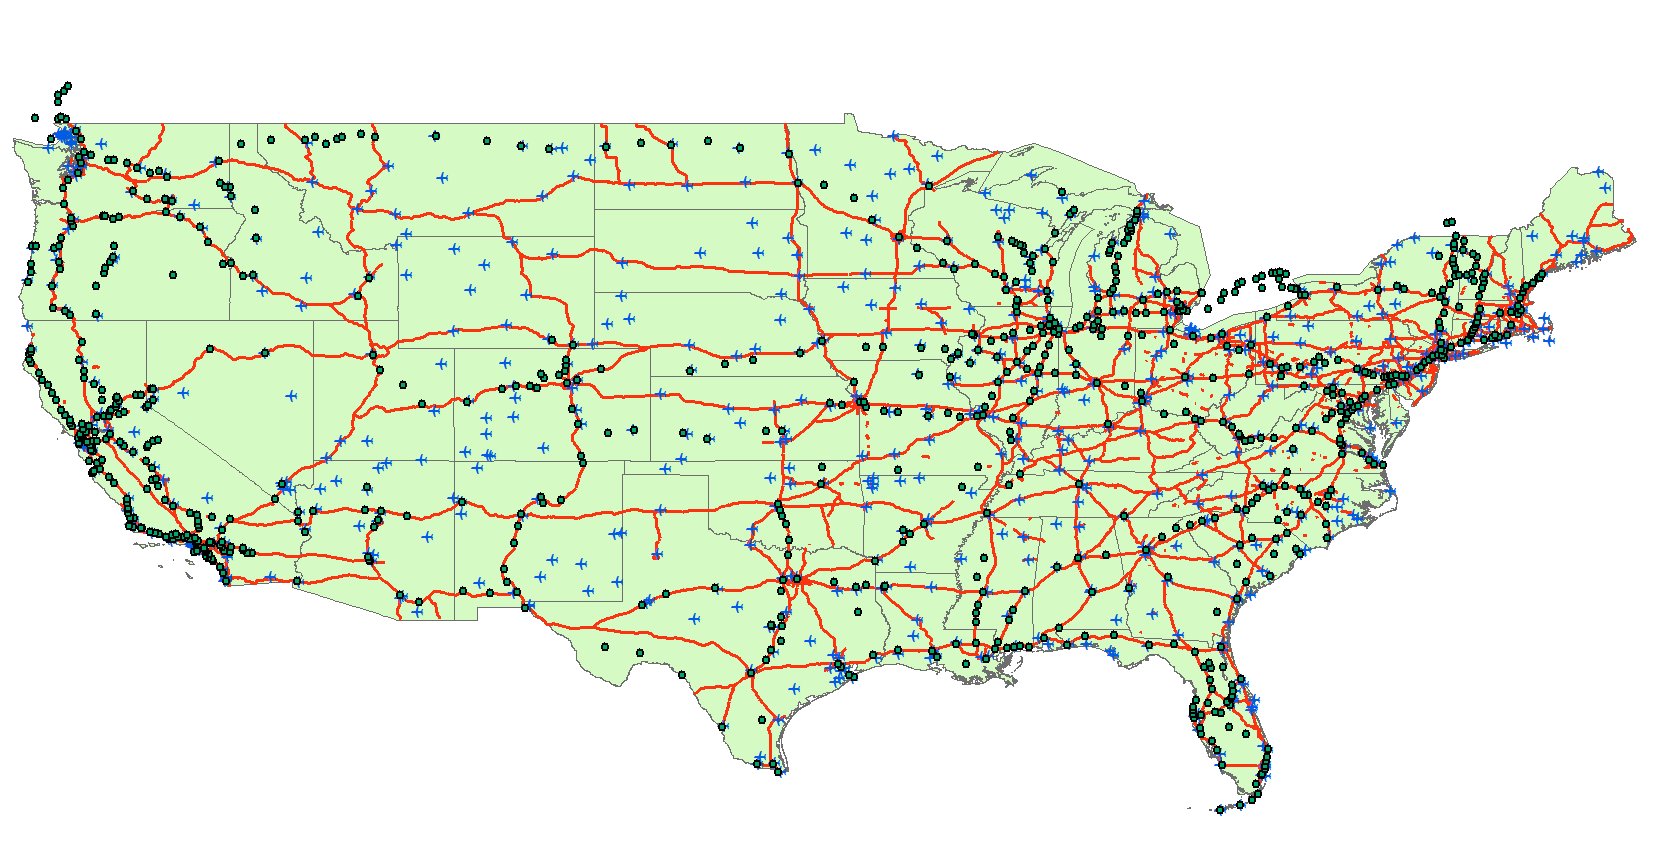 |
| US Interstate Highways, Airports and Train Stations |
| |
| The tables below give links to Esri shapefile data for US Interstates, airports and Amtrak stations. You amy want to refresh yourself by referring to the GIS lesson. Using the data in these shapefiles and the States shapefile, you can create this map in ArcGis and explore it yourself.
|
| |
|
|
|
| |
| Exercise: |
Load the aforementioned shapefiles into ArcGIS. Zoom in to Pennsylvania. In what areas of Pennsylvania are these infrastructures concentrated? |
|
| |
| The map below shows the FEMA administrative regions. The regions do not necessarily follow the patterns created by types of disasters. In addition many large disasters span more than one region. This requires much coordination across regions to prepare respond and recover from disasters. |
| |
 |
| Federal Emergency Management Agency (FEMA) Regions |
| |
| In the following modules we cover most of the natural disasters that affect the United States. Keep in mind that, while we cover the disasters linearly and independently, many of the disasters can cause other disasters. For example earthquakes can cause tsunamis and hurricanes can spawn tornados and create flooding. |
| |
|
| |
| Floods |
| |
| Definition: |
Flood: A general and temporary condition of partial or complete inundation of two or more acres of normally dry land area
Source: FEMA FloodSmart Glossary |
|
| |
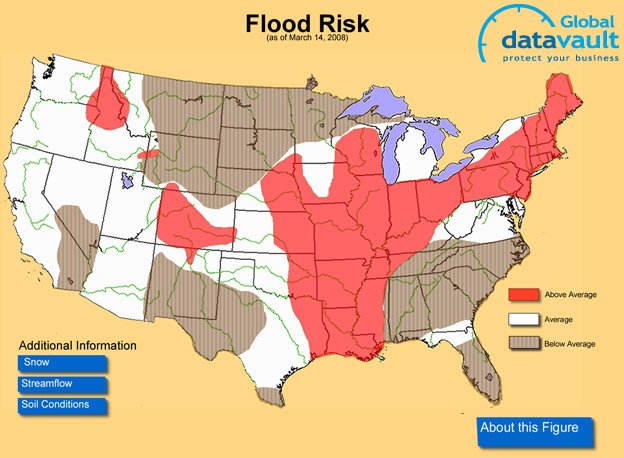
| Floods are the most common natural disaster in the United States. Every state is at some risk to flooding. Floods cause more deaths and damage than any other natural disasters. The map below shows US flood risk on March 14, 2008. Floods are the result of large thunderstorms, hurricanes, snow melt, tidal surges, dam failures (rarely) and other accumulations of groundwater. |
| |
 |
| |
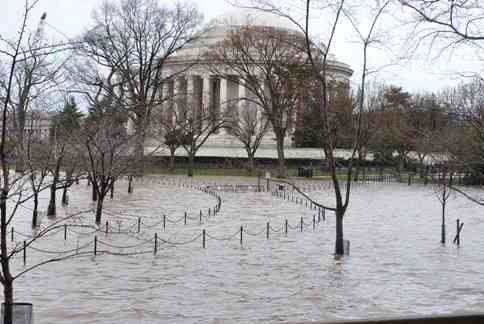
| The picture below shows the flooding of the Potomac River at the Jefferson Memorial on March 15, 2010. This flood was caused by a combination of tides, snow melting upstream and spring rains. |
| |
 |
|
| |
| Thunderstorms |
| |
| Definition: |
Thunderstorms:
Small scale weather patterns resulting from the formation of cumulonimbus clouds. The storms form as air currents move upwards into the atmosphere through convection. Overall, a thunderstorm usual builds and diminishes within about 30 minutes on average. Severe thunderstorms create one or more of the following:
- Hail of at least 3/4 in
- Tornadoes (Less than 1% of the cases)
- Winds in excess of 58 mi/hr
Source: National Weather Service |
|
| |
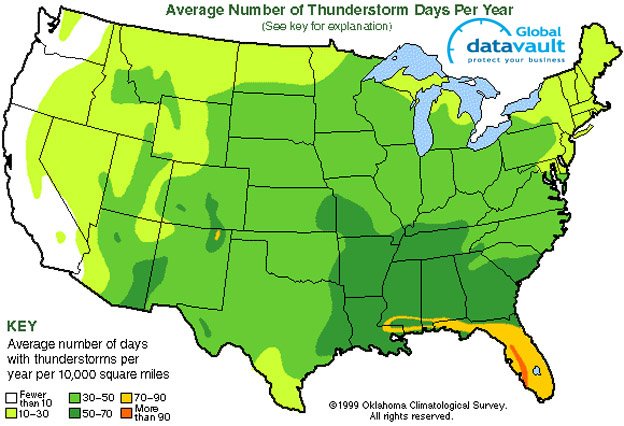
| Thunderstorms occur regularly in every location as shown in the map below. Most thunderstorms are relatively mild. However they can create lightning and flooding. |
| |
 |
| |
| US Thunderstorms |
| |
| Definition: |
Lightning:
A visible electrical discharge produced by a thunderstorm. The discharge may occur within or between clouds, between the cloud and air, between a cloud and the ground or between the ground and a cloud.
Source: National Weather Service |
|
| |
|
Lightning kills more people each year on average than hurricanes and tornadoes combined. There are about 100 lightning fatalities annually in the United States. The map below shows the frequency of lightning strikes. |
| |
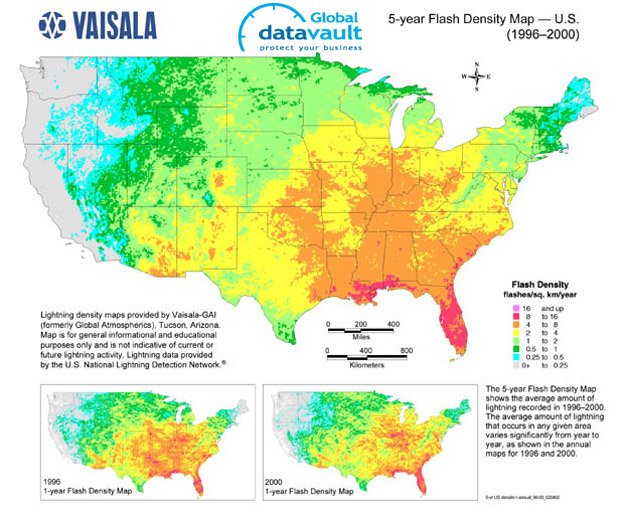 |
| US Lightning Strikes |
| |
|
| Tornados |
| |
| Definition: |
Tornado: A violently rotating column of air extending from a thunderstorm to the
ground. The most violent tornadoes are capable of tremendous destruction with wind speeds of
250 mph or more. Damage paths can be in excess of one mile wide and 50 miles long. In an
average year, 800 tornadoes are reported nationwide. Every state is at some risk from this
hazard.
Source: FEMA Fact Sheet |
|
| |
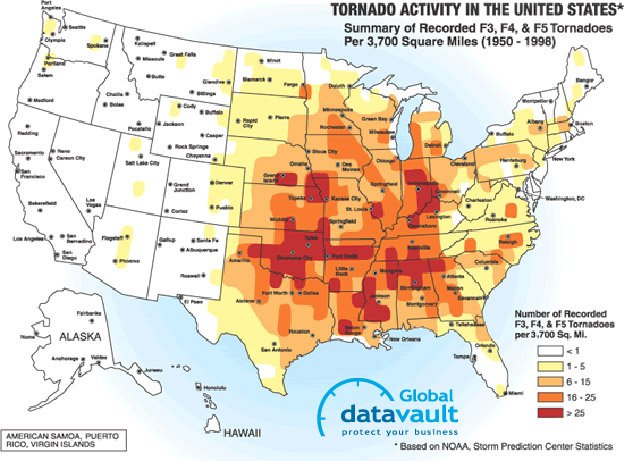
| Tornados are concentrated in the mid section of the United States as shown in the map below. They arise mainly from thunderstorms but can be caused by hurricanes. Tornados are measured by the Fujita Tornado Scale. This scale is enumerated below. |
| |
| Fujita Tornado Scaale |
| Scale |
Wind Estimate (MPH) |
Typical Damage |
| F0 |
< 73 |
Light damage - Some damage to chimneys; branches broken off trees;
shallow-rooted trees pushed over; sign boards damaged. |
| F1 |
73-112 |
Moderate damage - Peels surface off roofs; mobile homes pushed off
foundations or overturned; moving autos blown off roads. |
| F2 |
113-157 |
Considerable damage - Roofs torn off frame houses; mobile homes
demolished; boxcars overturned; large trees snapped or uprooted; light-object missiles
generated; cars lifted off ground. |
| F3 |
158-206 |
Severe damage - Roofs and some walls torn off well-constructed houses;
trains overturned; most trees in forest uprooted; heavy cars lifted off the ground and
thrown. |
| F4 |
207-260 |
Devastating damage - Well-constructed houses leveled; structures with
weak foundations blown away some distance; cars thrown and large missiles generated. |
| F5 |
261-318 |
Incredible damage - Strong frame houses leveled off foundations and swept away; automobile-sized missiles fly through the
air in excess of 100 meters (109 yds); trees debarked; incredible phenomena will occur. |
|
| |
 |
| |
|
| |
| Hurricanes |
| |
| Definition: |
Hurricane: Violent storms which bring intense winds, heavy rain, a storm surge, floods, coastal erosion, landslides, and tornadoes. While it is difficult to predict the exact time, place, and force of hurricanes, residents of the Atlantic and Gulf Coast states must be prepared. The season for hurricanes is June through November, with most hurricanes occurring mid-August to late October. Each season, on average, six hurricanes form in the Atlantic Ocean of which two become major hurricanes.
Source: FEMA Fact Sheet |
|
| |
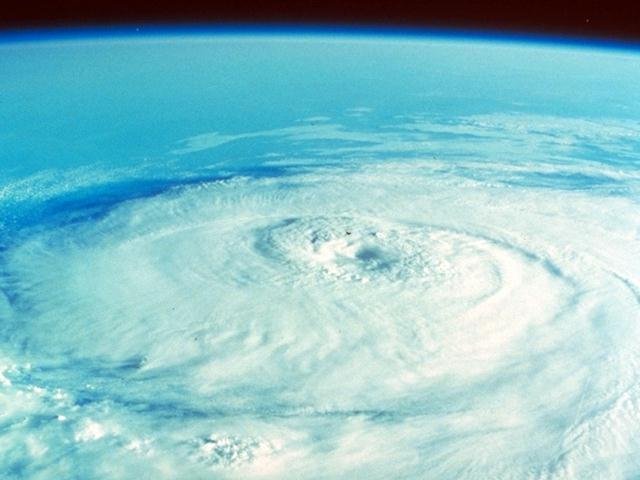
| Hurricanes are large and devastating storms. They can be hundreds of miles across. The image below shows a picture of a hurricane taken from space. With the exception of Hurricane Katrina most hurricanes result in low numbers of deaths. Most deaths result from the accompanying storm surge and not the high winds. |
| |
 |
| Photograph of a Hurricane Taken from Space |
| |
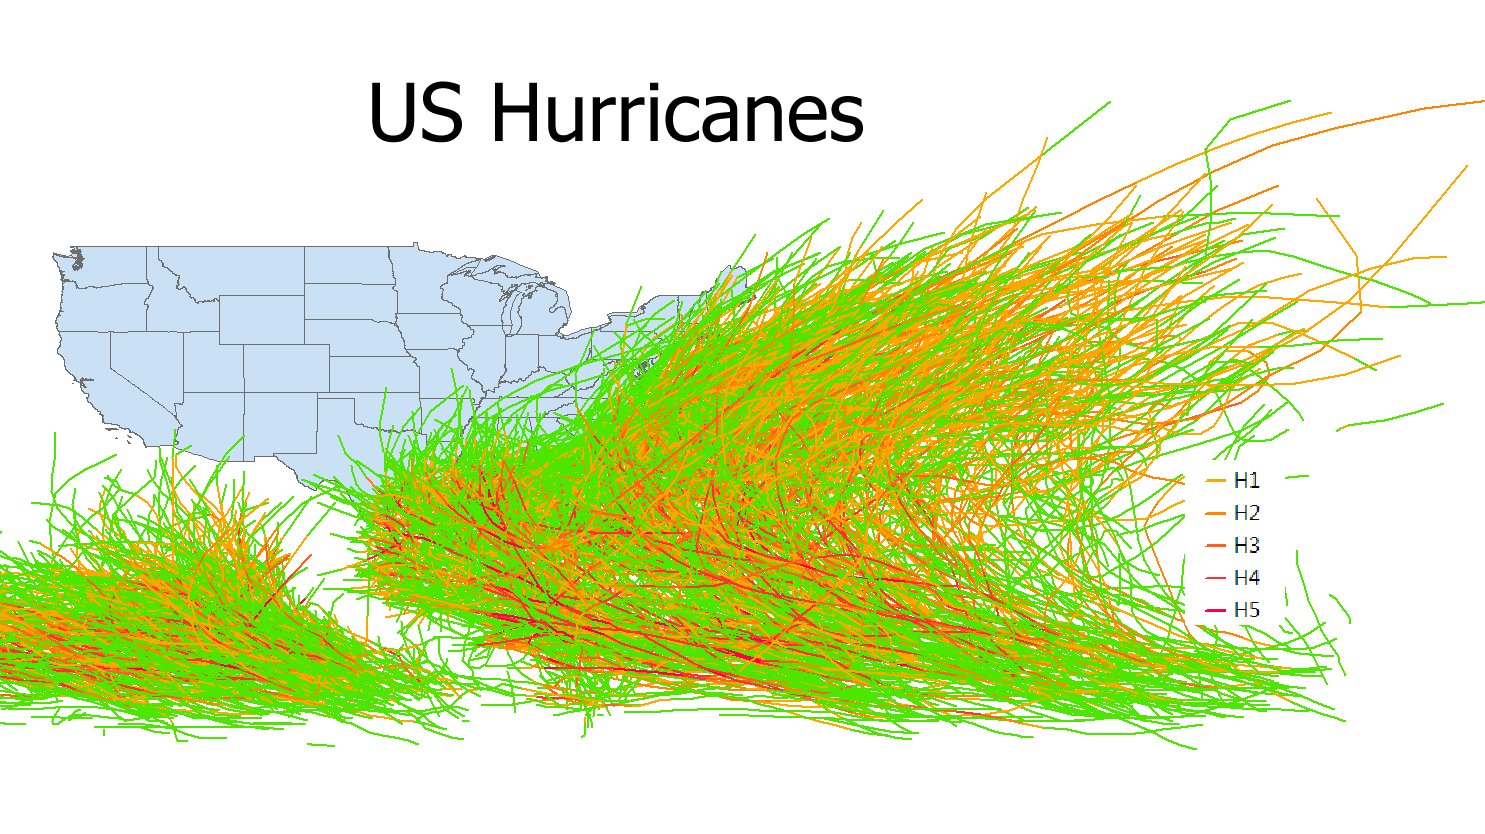
| The table below contains the Esri shapefile for the tracks of all hurricanes affecting the US. Following it is a map created in ArcGIS from the shapefile. |
| |
|
| |
 |
| Tracks of All US Hurricanes and Tropical Storms |
| |
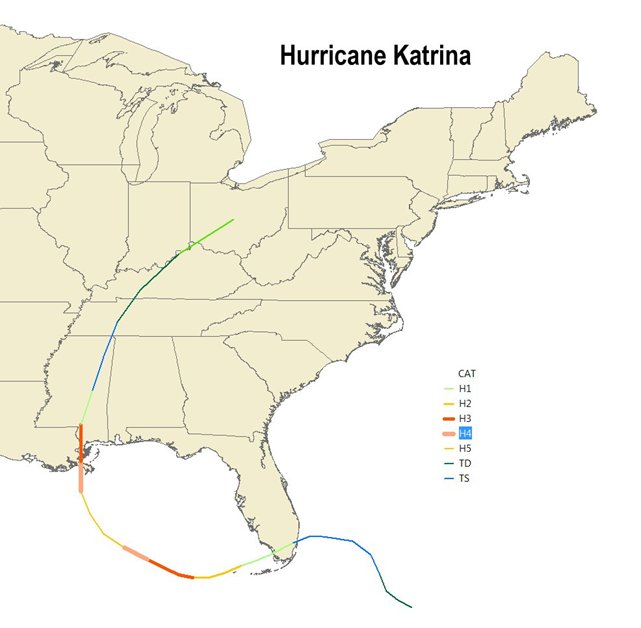
| The map below was created in ArcGIS as a selection from the shapefile for Hurricane Katrina, 2005. Each of the stages of the hurricane from Tropical Storm (TS) through Hurricane level 5 (H%) was color coded. The amassing of storm energy can be seen as the storm passed through the warm Gulf of Mexico waters. |
| |
 |
| Track of Hurricane Katrina |
| |
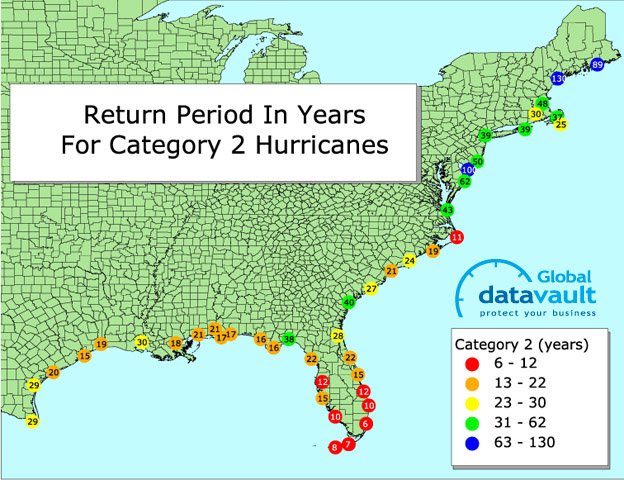
| Emergency managers are interested in the patterns of recurrence of hurricanes in their areas. The map below shows the frequence of recurrence of Category 2 or greater hurricanes in the US. Florida, coastal north arolina and the Gulf Coast are freequently visited by these hurricanes. |
| |
 |
| Revisit Time of Category 2 Hurricanes |
| |
| Themap below shows all historical hurricanes whose eyes passed within 50 miles of Washington, DC. |
| |
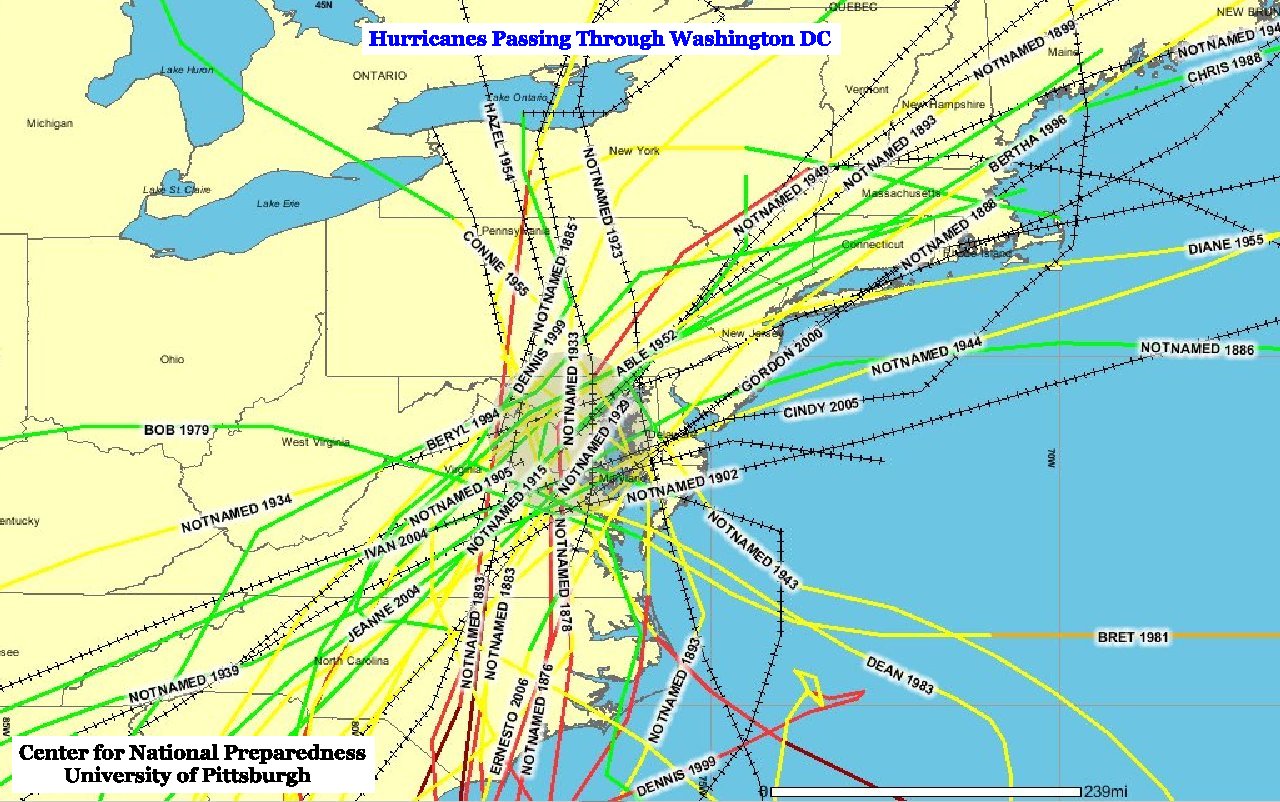 |
| Tracks of All Hurricanes Passing within 50 Miles of Washington DC |
| |
| The next map shows a typical pattern of hurrincanes in a single season (2005). |
| |
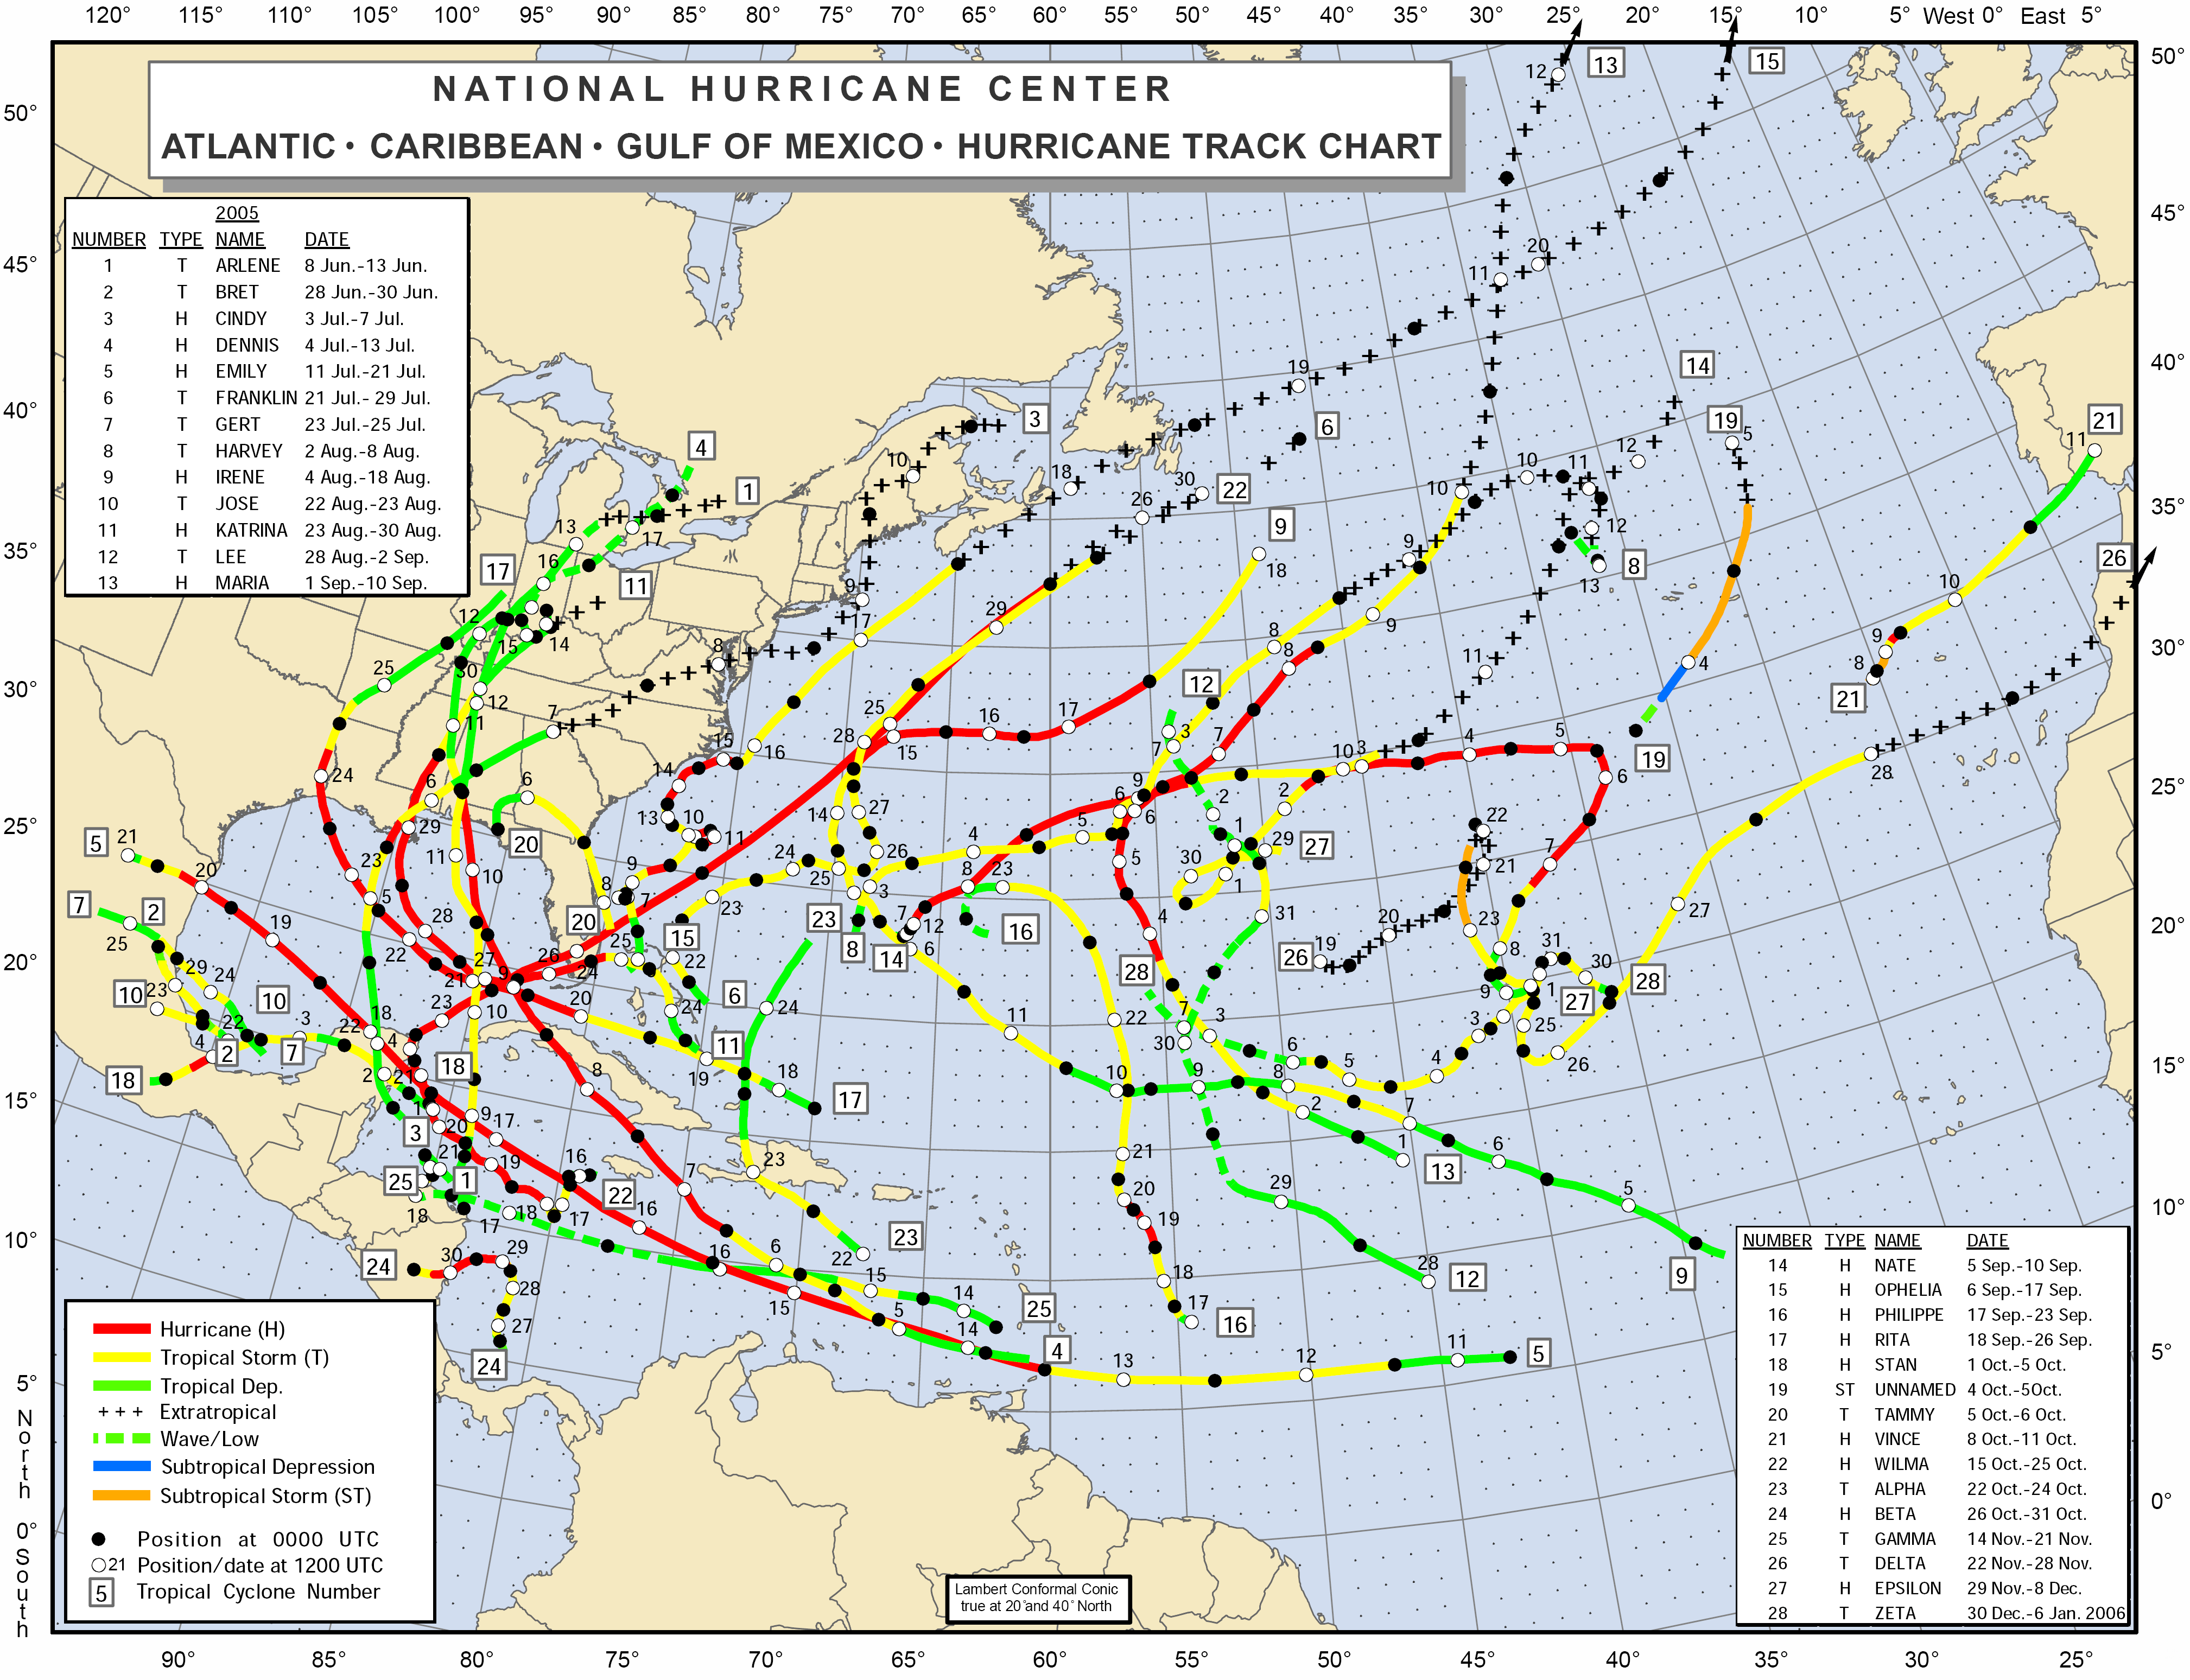 |
| Tracks of All US Hurricanes During the 2005 Hurricane Season width=700> |
| |
| Exercise: |
Use the Esri shapefiles to create a map of the hurricanes occurring from 2000 - 2005. |
|
|
| |
| Wildfires |
| |
| Definition: |
Wildfire:
An uncontrollable fire spreading through vegetative fuels, exposing and possibly consuming structures.
Source: Horry County, South Carolina ALL HAZARDS MITIGATION PLAN |
|
| |
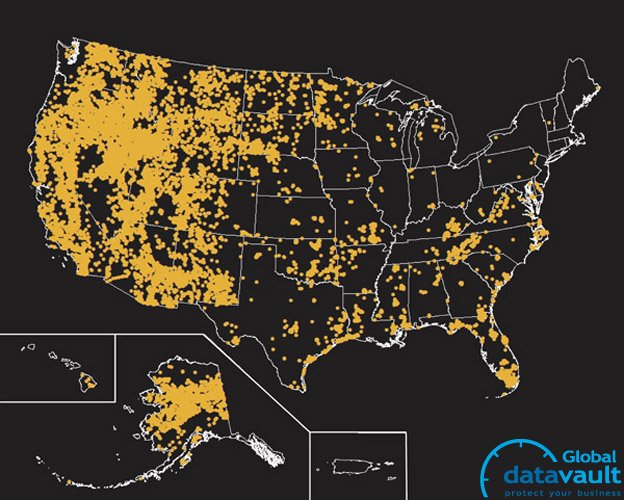
| Wildfires occur everywhere but they are prevalent in the vast forest areas of the US west. They can consume from tens to thousands of acres. Lightning is a major cause of wildfires as is accidents and human carelessness. |
| |
 |
| |
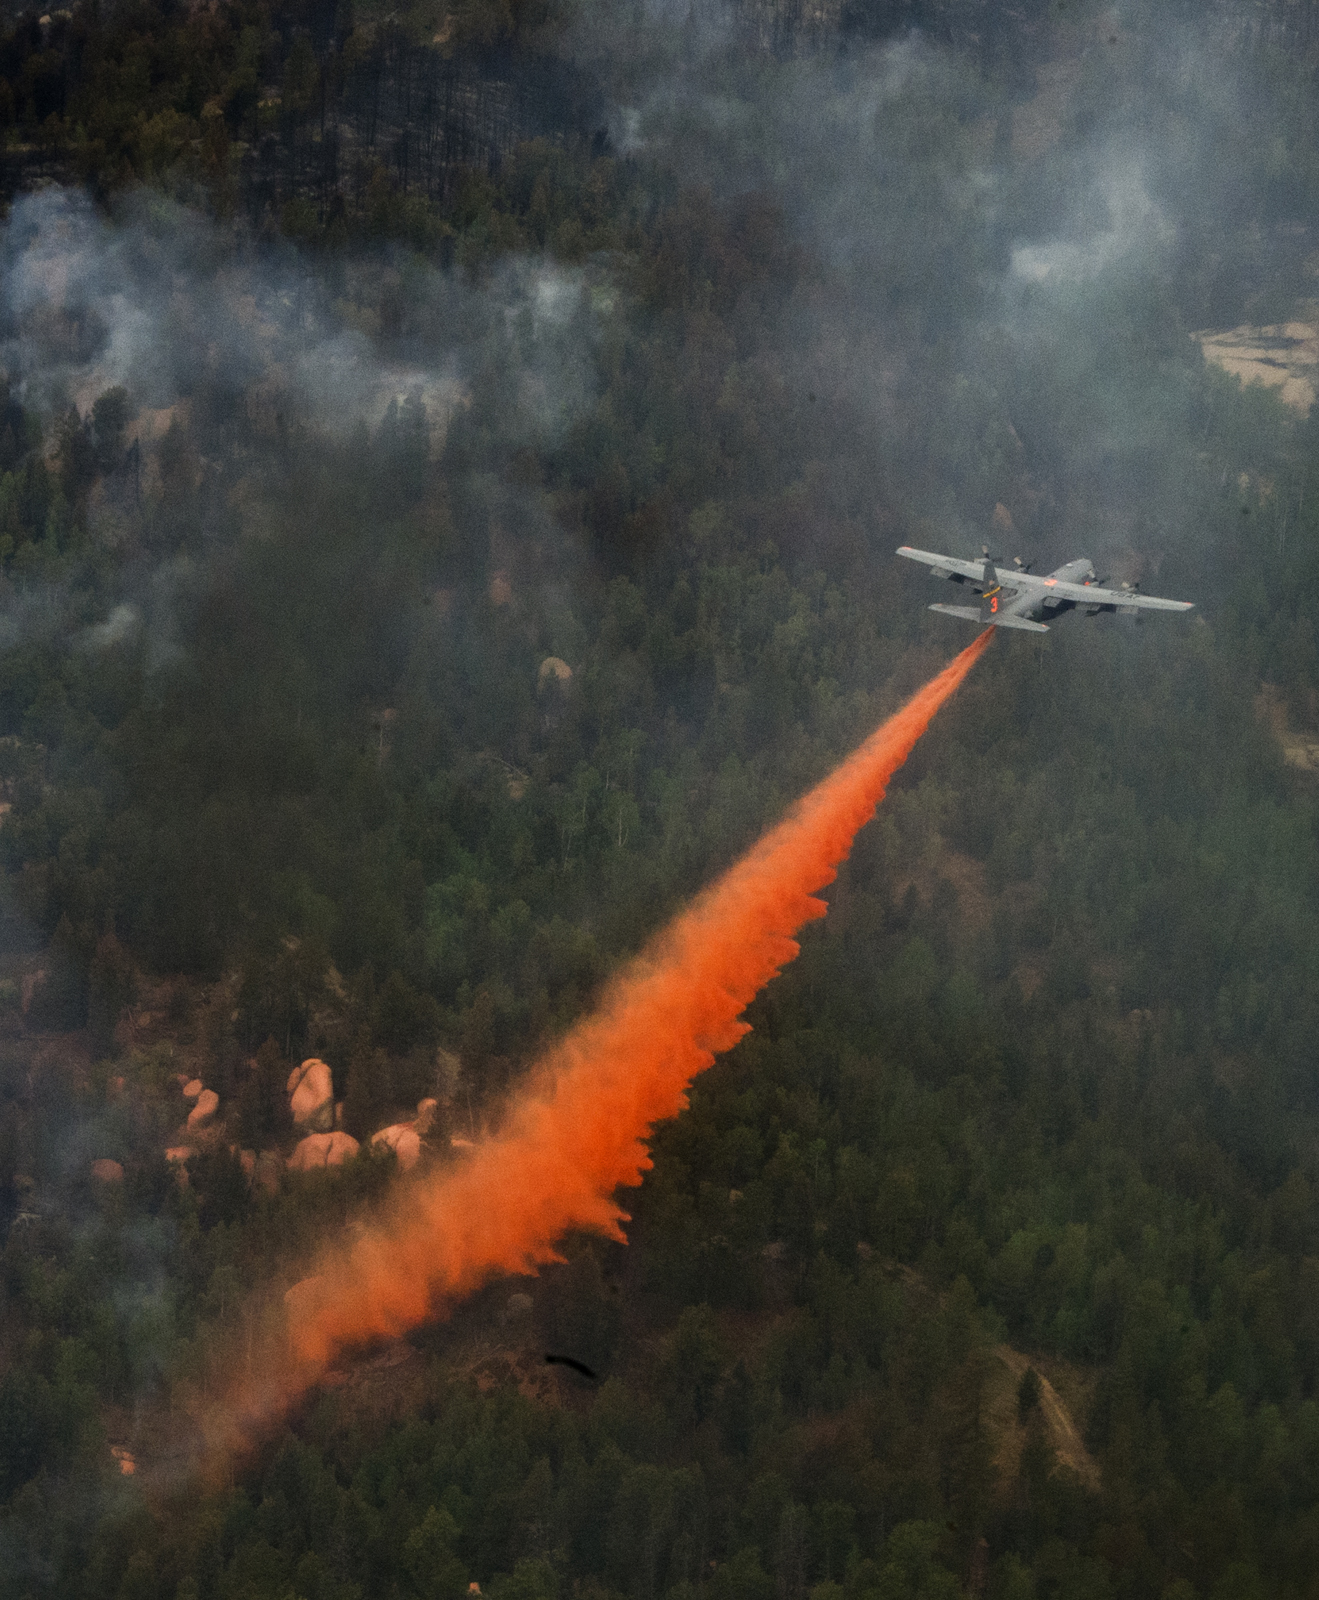
| Wildfires, particularly in the western US are so large and in remote areas that land based firefighting
is difficult. The military has developed the
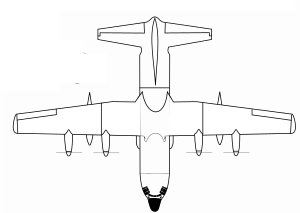
Modular Airborne FireFighting System (MAFFS) which can be fit into a C-130 cargo plane. The accompanying picture shows a C-130 outfitted with a MAFFS module dropping fire retardent on a wildfire in Colorado. |
| |
 |
| |
| The Lockheed C-130 Airframe is essentially a blank canvas that can be configured with a number of military and emergency versions.
It can be outfitted to carry hundreds of personnel ( Troops, Responders or Evacuees ) with provisions. In another configuration, the C-130 can carry multiple vehicles such as trucks, ambulances and other conveyances, |
C-130 Profile |
| |
|
| |
| Earthquakes |
| |
| Definition: |
Earthquake: Ground shaking caused by a sudden movement on a fault or by volcanic disturbance. (USGS, Putting Down Roots in Earthquake Country, 2007, Glossary)
Source: USGS, Putting Down Roots in Earthquake Country |
|
| |
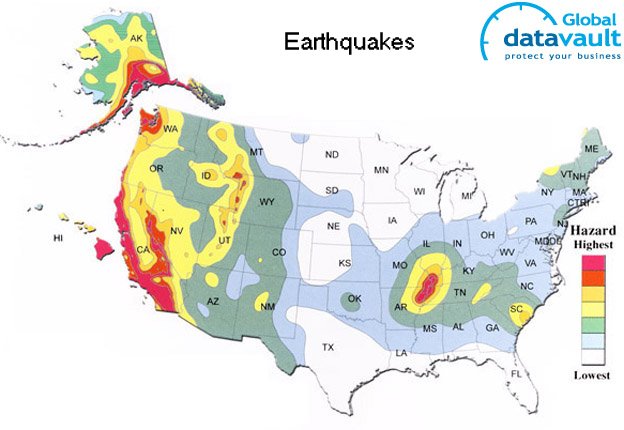
| Below is shown a map showing earthquake hazard areas in the US. Earthquakes are concentrated on the West Coast and the coast of Alaska. One area in central US where earthquakes occur is along the New Madrid Fault. In 1812 the largest earthquake in central US occurred along this fault. The effects of this earthquake were felt in Pittsburgh and church bells in Boston rang as a result of the shaking. |
| |
 |
| |
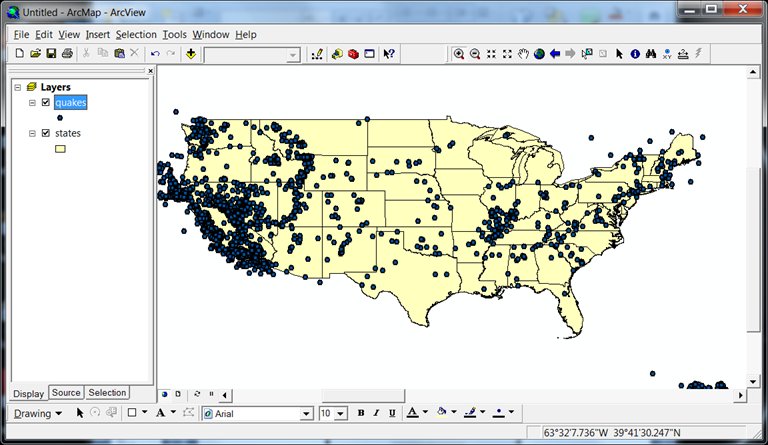
| The table below shows the components of an Esri polygon shapefile that contains the representations for all of the earthquakes of the United States. |
| |
|
| |
| The image below shows a screen shot of the ArcGIS interface for this map data. |
| |
 |
| |
| Exercise: |
Load the aforementioned shapefiles into ArcGIS. Explore the central US and Alaskan earthquakes. |
|
|
| |
| Volcanos |
| |
| Definition: |
Volcano
A volcano is a vent at the Earth's surface through which magma (molten rock) and associated gases erupt, and also the cone built by effusive and explosive eruptions.
Source: US Geological Survey (USGS) |
|
| |
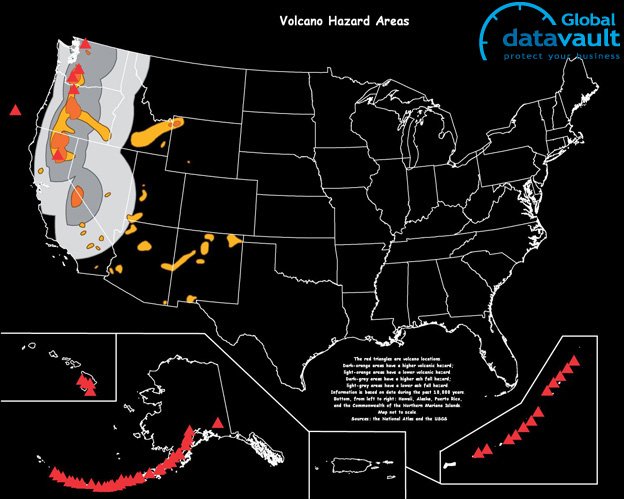
| The map below shows the hazard areas for volcanos in the United States. Most off the volcanic activity occurs from mid-California north through the Alaskan coast. |
| |
 |
| |
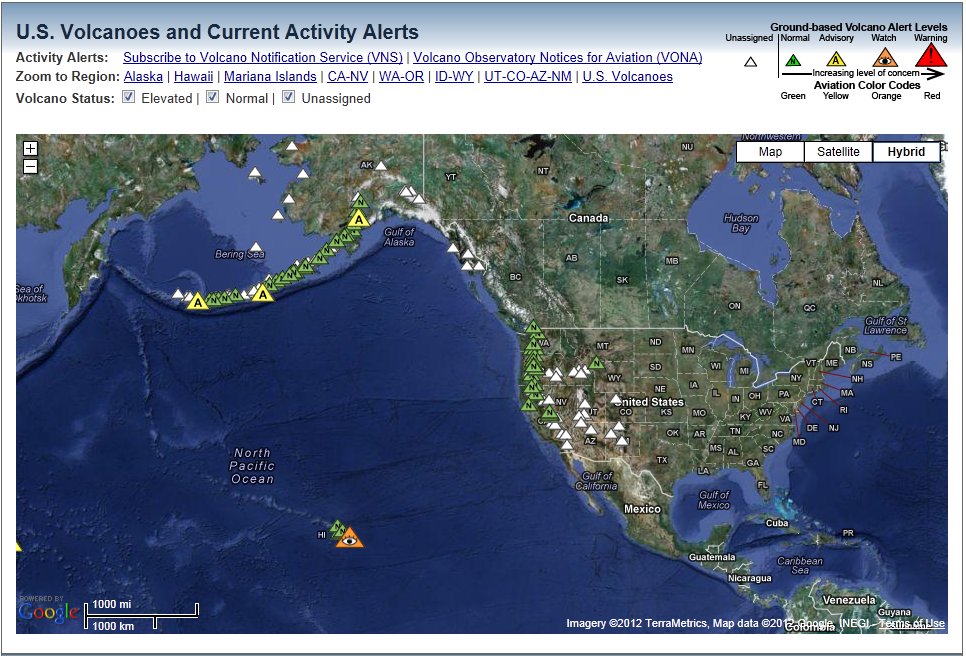
| The US Geological Survey (USGS) has an interactive web site shown below that tracks volcanos in real time. That web site can be found at http://volcanoes.usgs.gov |
| |
 |
| |
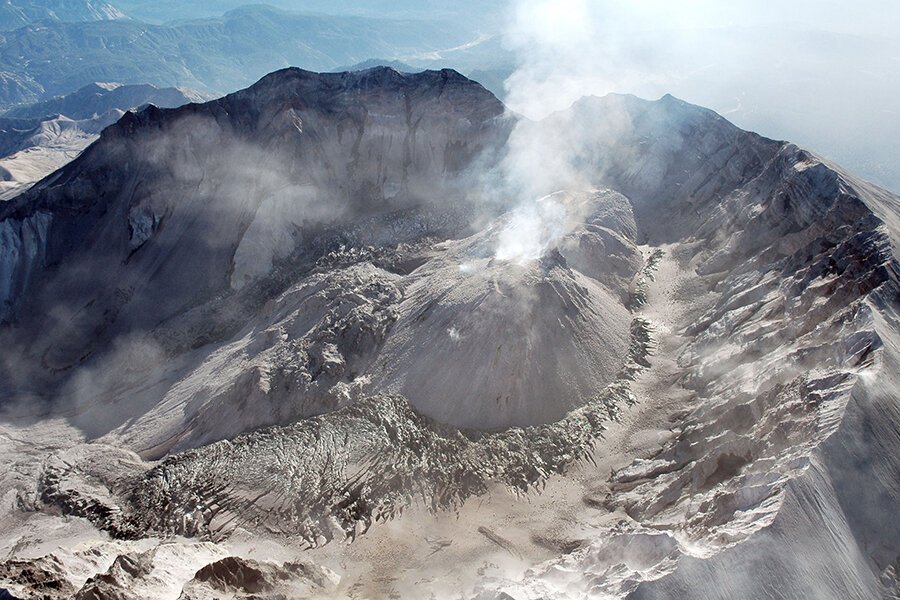
Mount Saint Helens Source: Christian Science Monitor |
| |
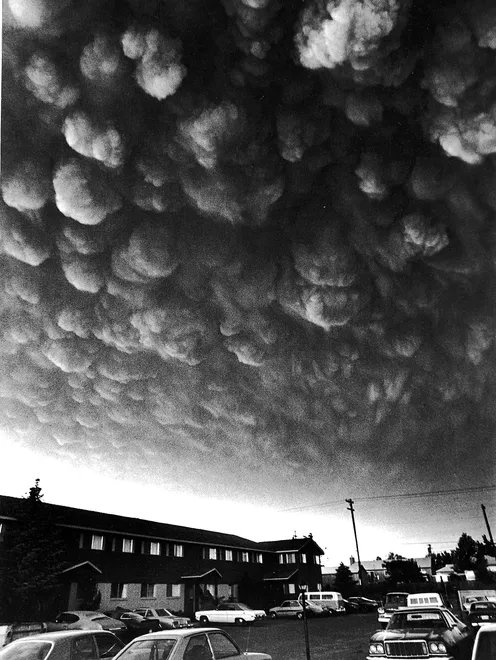
Mount Saint Helens Soot Cloud Over Richland Washington
Source: Asssociated Press (AP) |
|
| |
| Tsunamis |
| |
| Definition: |
Tsunami: Also known as seismic sea waves (mistakenly called “tidal waves”), is a series of enormous waves created by an underwater disturbance such as an earthquake, landslide, volcanic eruption, or meteorite. A tsunami can move hundreds of miles per hour in the open ocean and smash into land with waves as high as 100 feet or more.
Source: FEMA Fact Sheet |
|
| |
| |
| |
 |
| |
The image to the right is a picture of a tsunami warning sign. This sign can be found at Monteray Bay in California.
The magnitude of the tsunami wave is increased when it enters an estuary such as a bay or river inlet. | 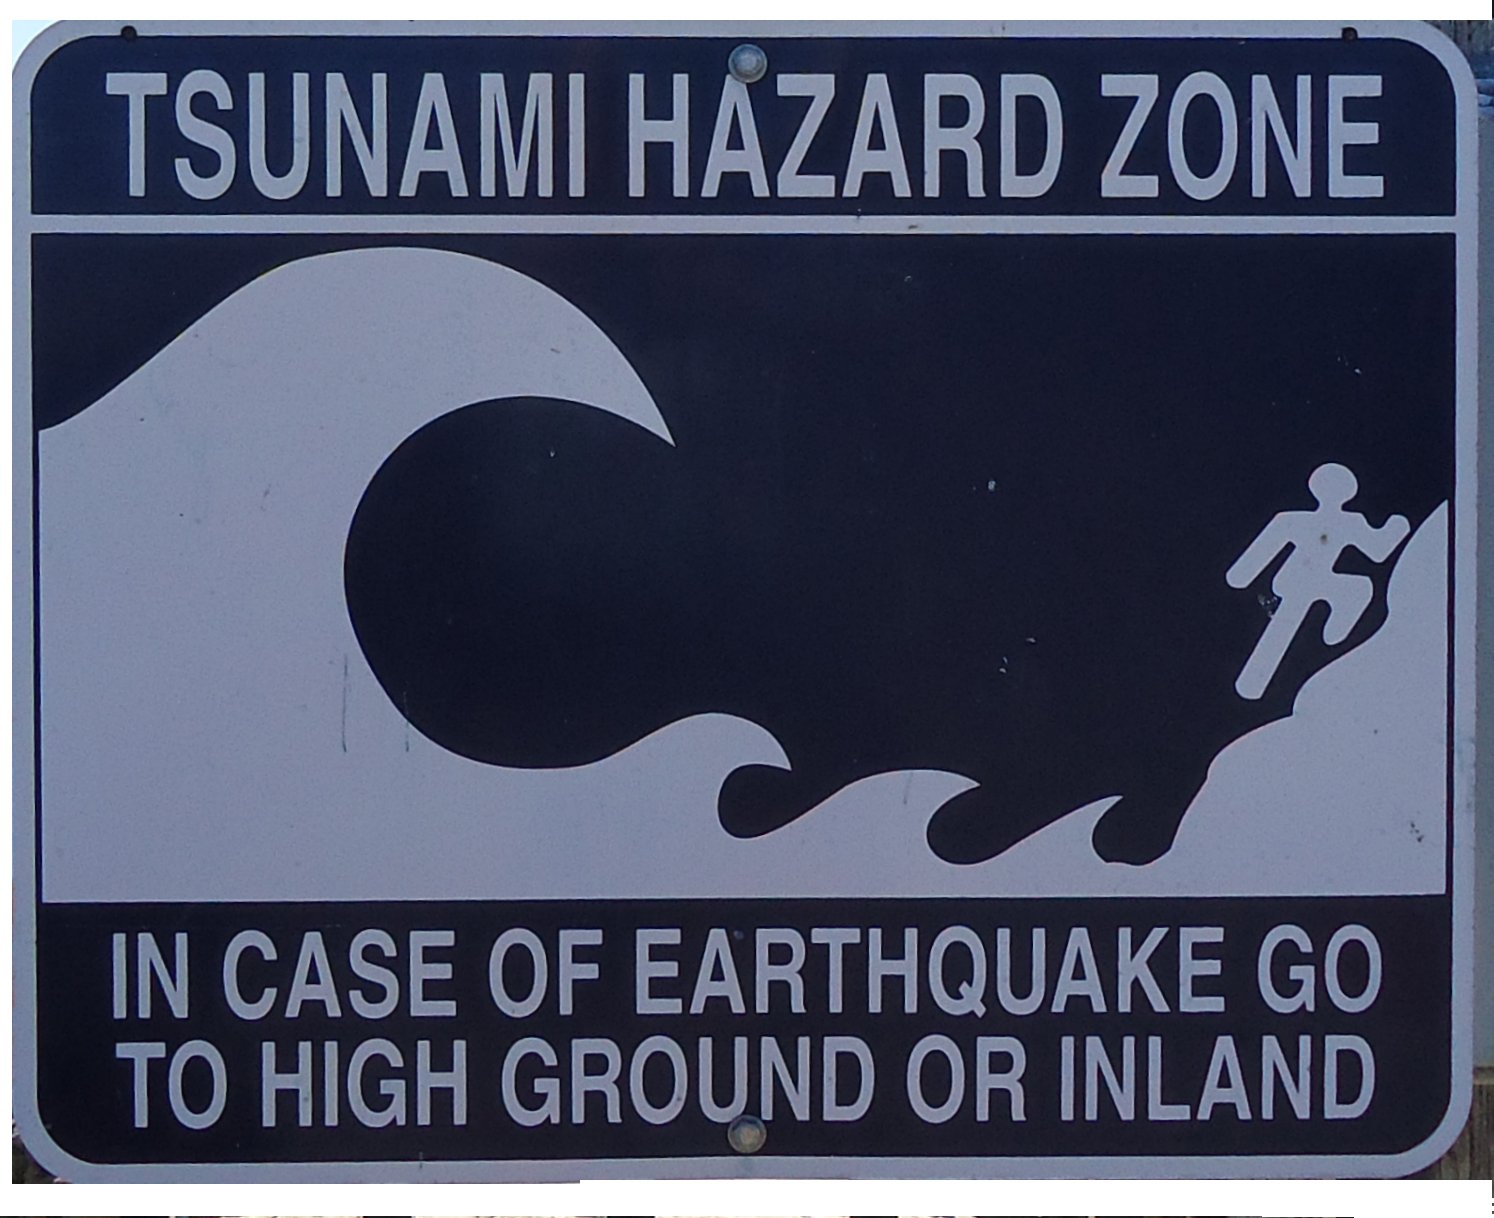 |
|
|
| |
| Pandemics |
| |
| Definition: |
Pandemic: “An epidemic (a sudden outbreak) that becomes very widespread and affects a whole region, a continent, or the world.
Source: MedicineNet.com |
|
| |
Historically pandemics have been the largest killers of humans in the US. It is estimated that the 1918 Spanish flu pandemic infected 20-40% of the population. Nearly 675,000 people died in the United States and 50 million died worldwide.
In 1957, the Asian flu pandemic resulted in about 70,000 deaths in the United States.
The CDC estimates that 43 million to 89 million people had Swine flu (H1N1) in the 2009 - 2010 flu season. They estimate between 8,870 and 18,300 H1N1 related deaths. 300 of those deaths were in the United States.
Better nutrition, flu vaccines, easier access to healthcare and other factors have contributes to the mitigation of this risk. Pandemic still looms as the largest potential killer.
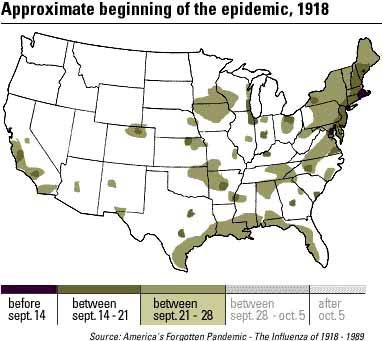
The map below shows the spread of the 1918 flu in the US. The flu was introduced in the US by soldiers returning from World War I. In four weeks the flu had spread across the entire US. |
| |
 |
| |
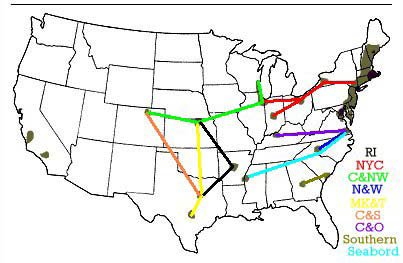
| Flu is largely spread by human to human contact. The pattern shown above suggests that trasportation system at the time (trains, boats and horses) played a major part in the distribution of the flu. The map below shows the rail system in the easteern US in 1918. Note how well the outbreak areas and rail system are correlated. Also note that the areas in the west to which the flu first spread are food producing (particularly beef). The transportation of beef and their human accompaniers to Chicago played a role in the further spread of the flu. |
| |
 |
| |
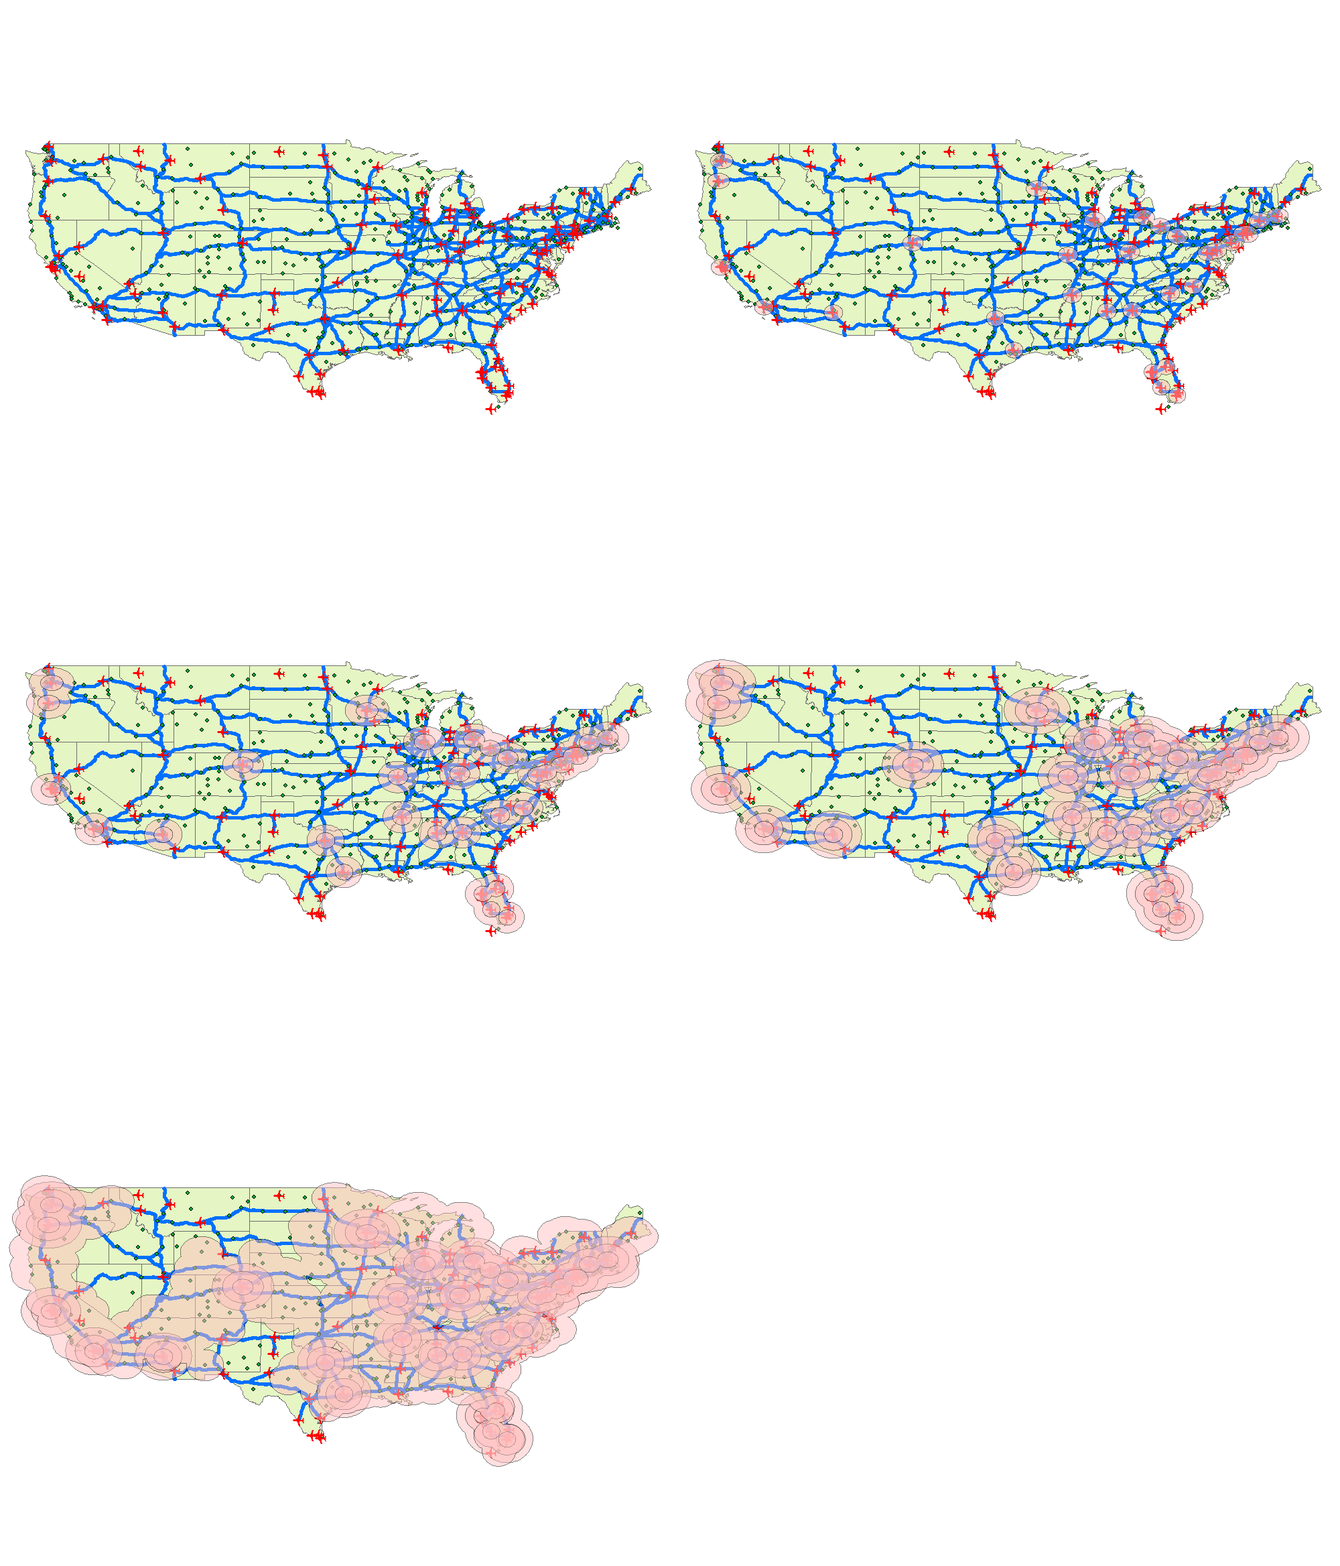
The next image is a simulation of the potential spread of a pandemic in modern times. The map shows international and national airports as well as interstates. The premise of the simulation is that passengers arrive at international airports with flights from Europe. To get home, they either get in their car or take a connecting flight to their home city.
Each step in the simulation is one hour of simulated time. Thus the simulation encompasses four hours. Click your browser's refresh button to restart the simulation.
We conclude that the flu is everywhere in the US in about a day or two. Note that this is a reasonable conclusion since air travel is much faster than travel by rail and cars are significantly faster than horses.
|
 |
The above conclusions should be of particular concern to emergency managers and planner. The typical flu asymptomatic in humans for two days. This means that people could be unknowingly bee spreading the flu. Second, some flu viruses live on some surfaces for as much as two days.
The end conclusion is that a pandemic could be everywhere before we can detect its presence and take appropriate action. |
|
| |
| Landslides |
| |
| Definition: |
Landslide: In a landslide, masses of rock,
earth, or debris move down a slope. Landslides may be small or large, slow or rapid. They are
activated by storms, earthquakes, volcanic eruptions, fires, and human modification of land.
Source: FEMA NIMS Glossary |
|
| |
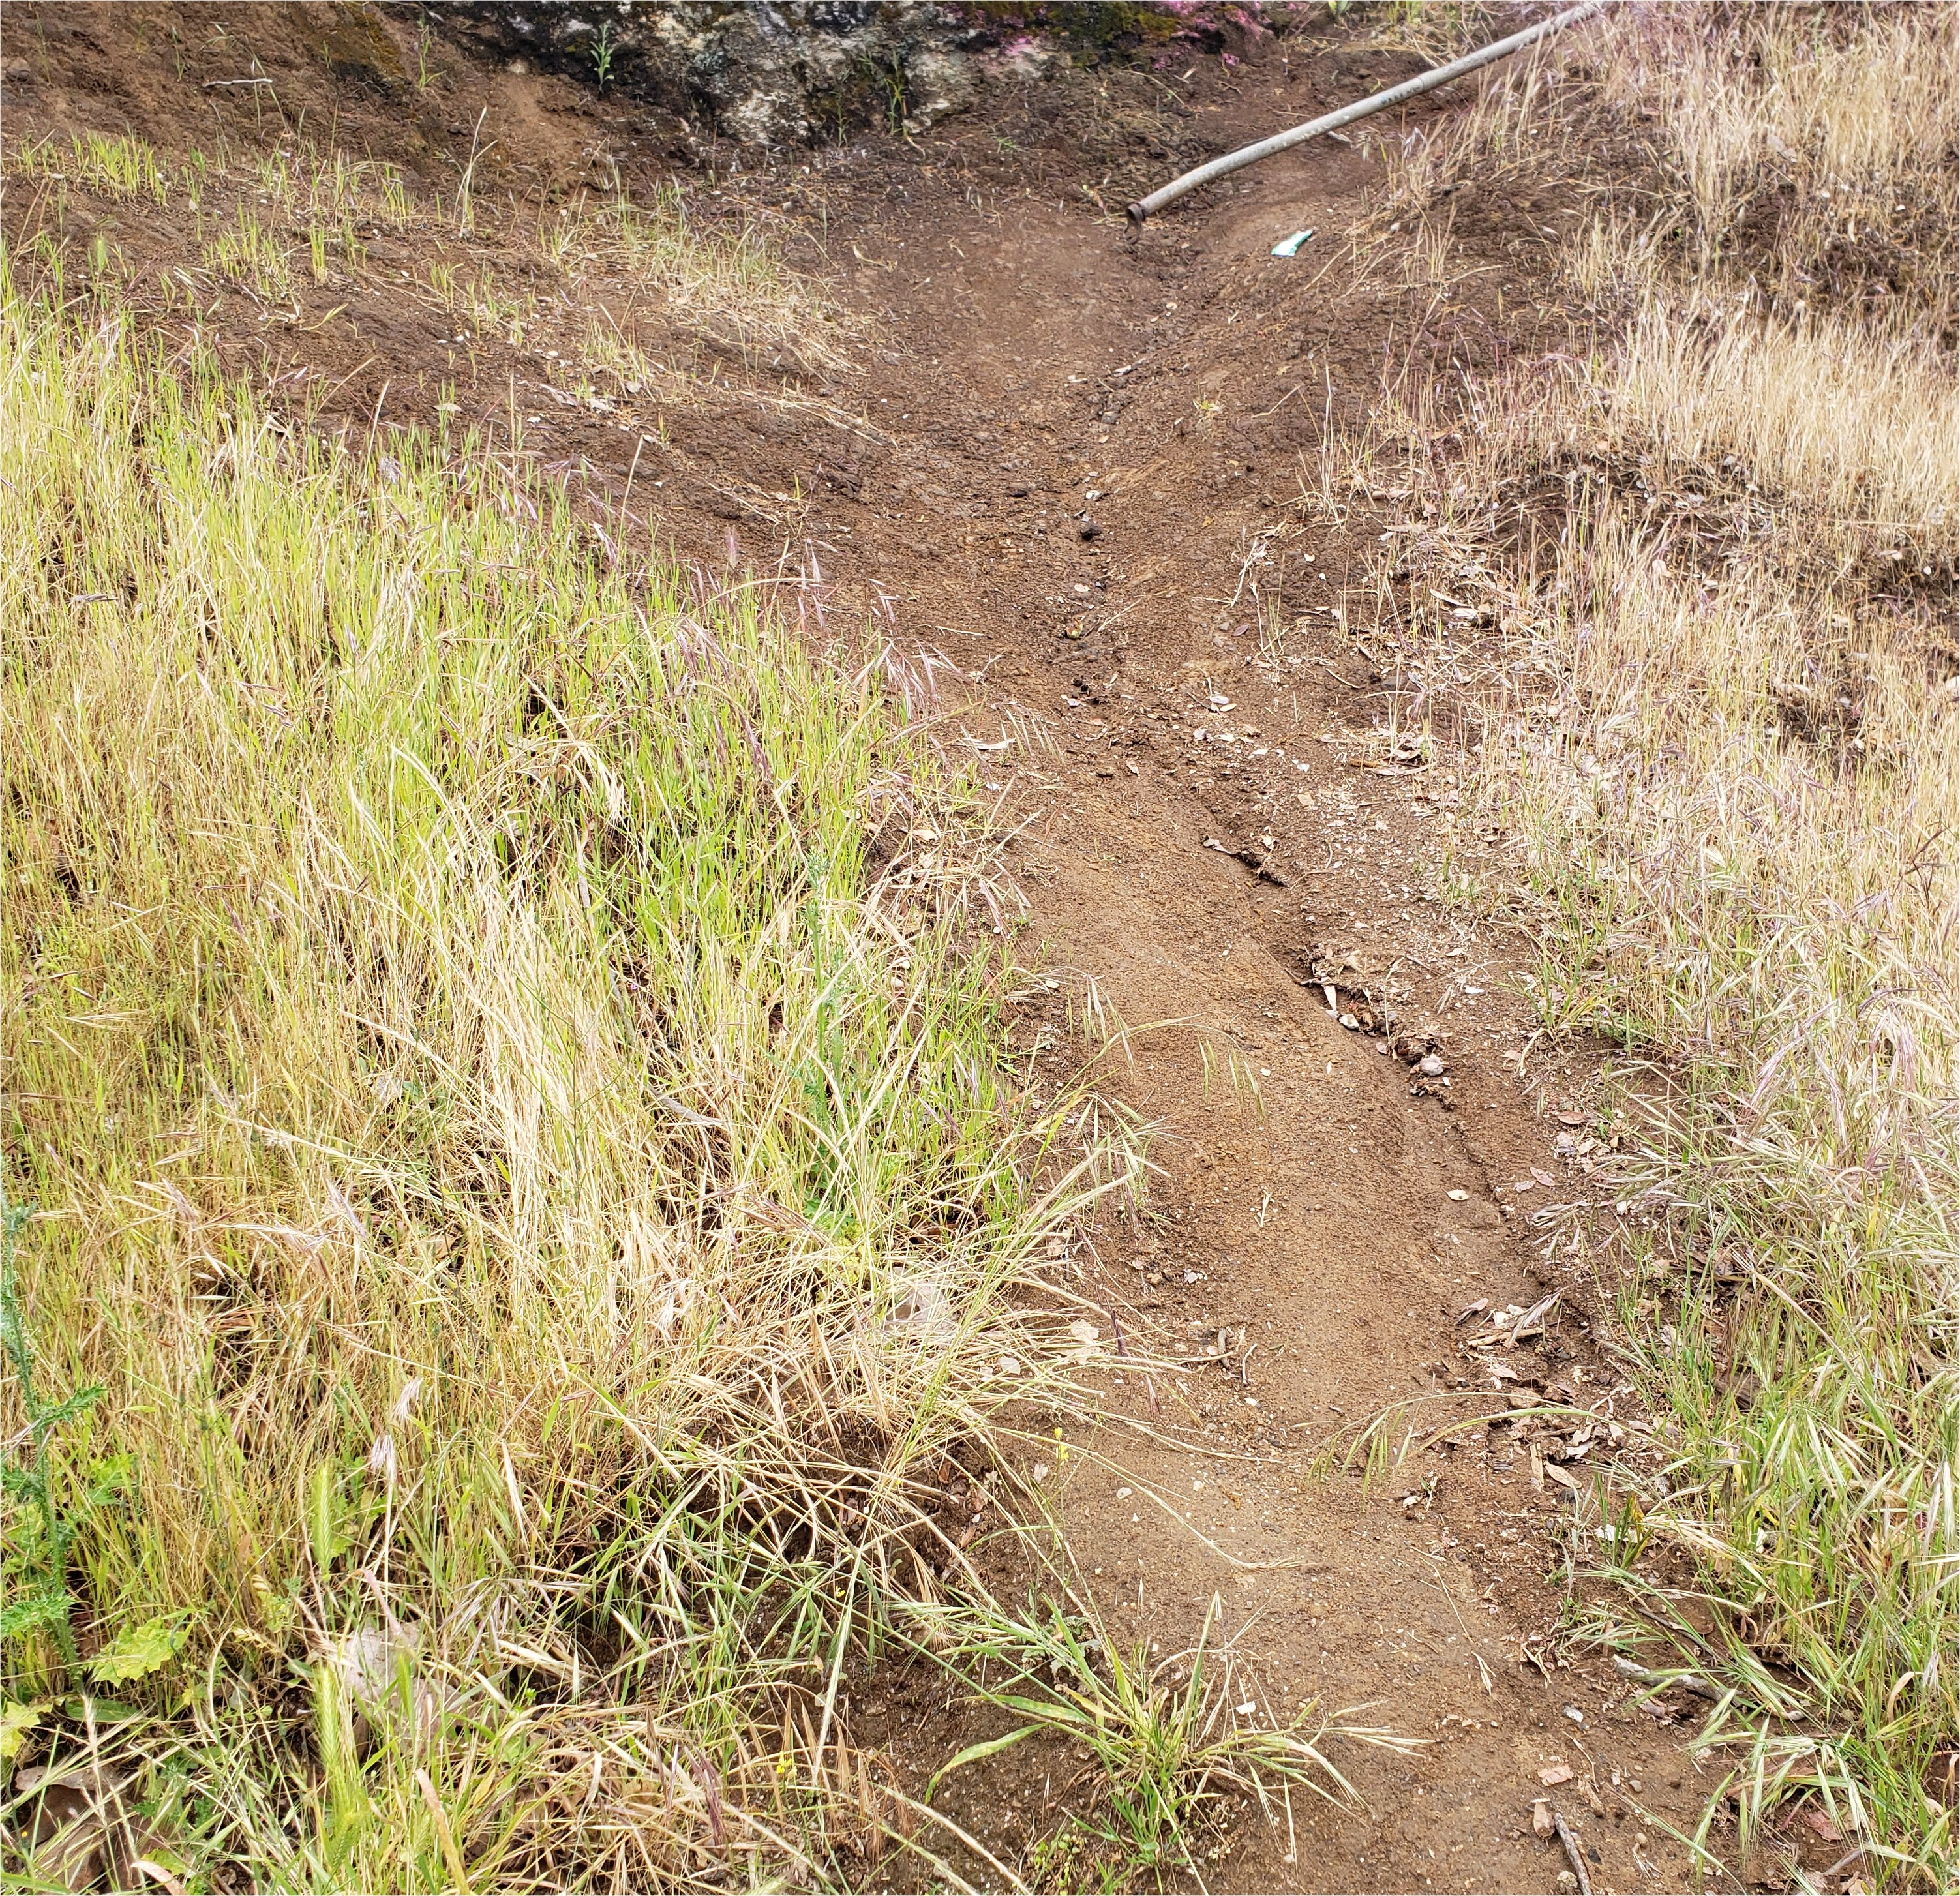
Los Angeles Landslide |
| |
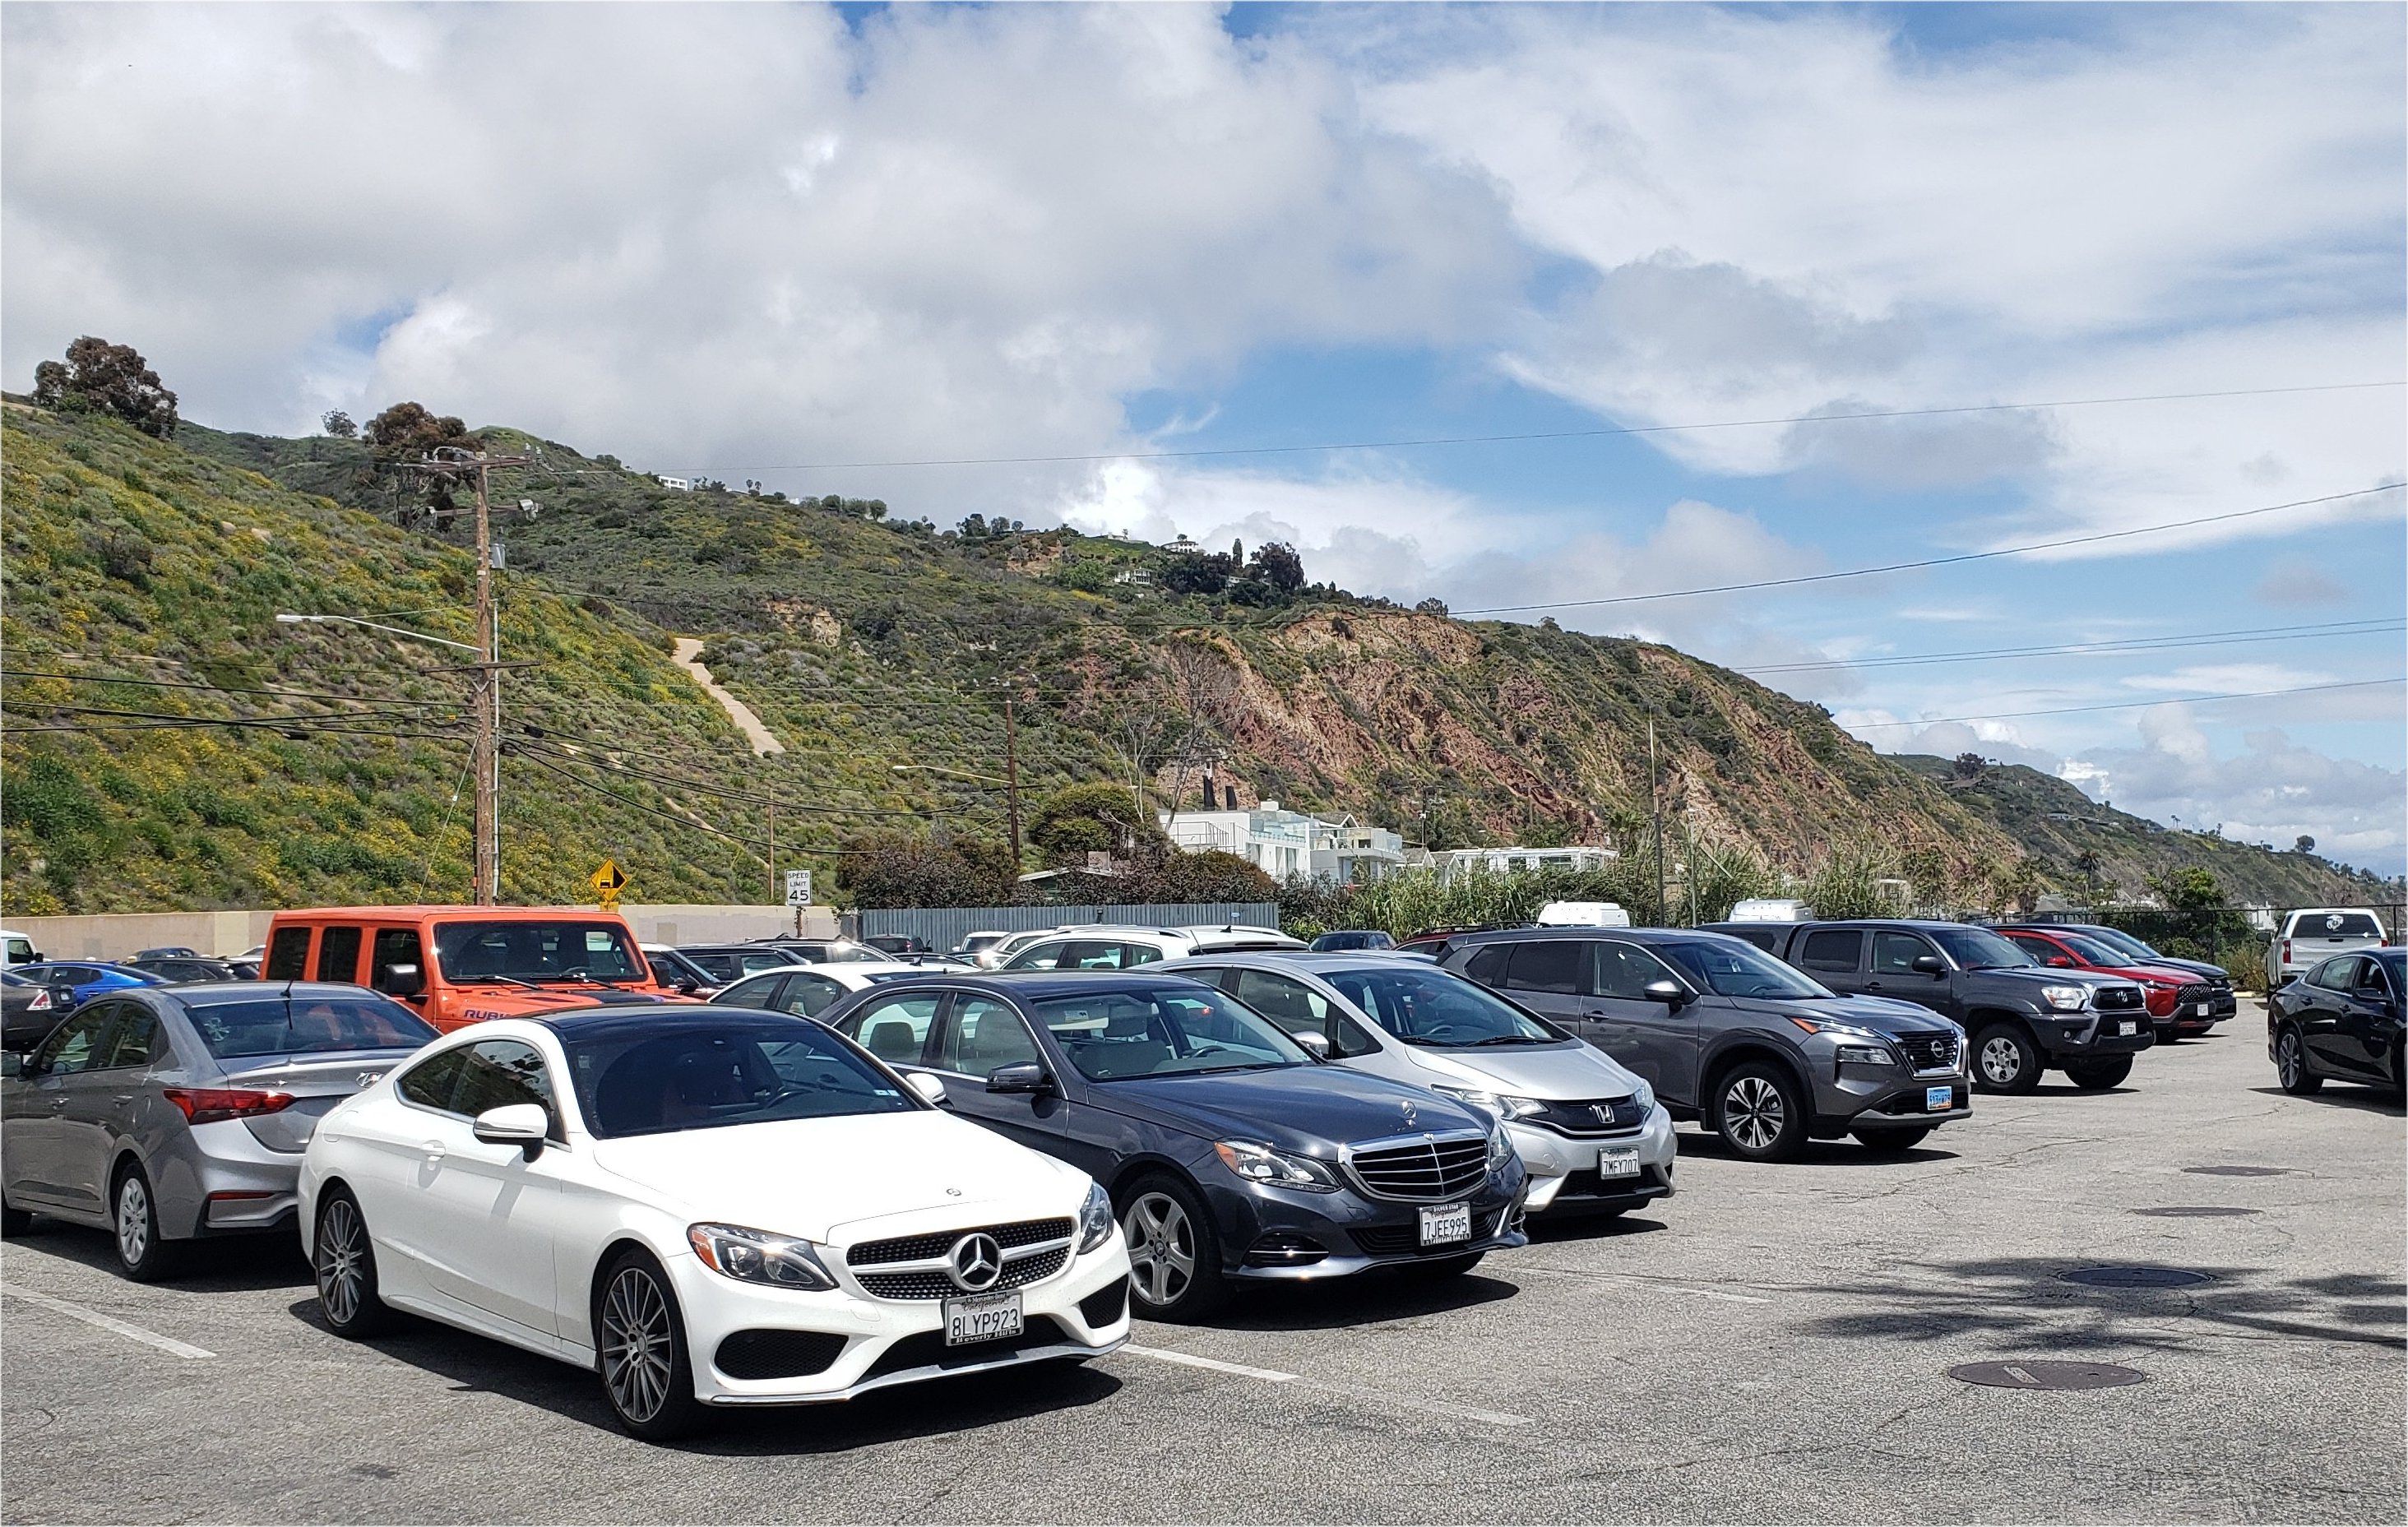
Malibu Landslides |
| |
|
| |
|
| Copyright © 2011 - 2024 Ken Sochats |


