Emergency Problem Solving, Decision-Making and Risk
.
Uncertainty
In this section we will explore decision making in uncertain situations. We will look at two general cases. First where we can evaluate alternatives using a single factor. In many real emergency decisions we do this with respect to some net cost. We will also look at decision making in multidimentional situations where there are multiple factors that contribute to our evaluating alternatives.
To introduce decision making under uncertainty, we will use a common and concrete example: a game of chance. One such game of chance is the Daily Number from the Pennsylvania Lottery. In the simplest version of play for the Daily Number, players pick one of a thousand numbers ranging from 000 to 999. At play time, the Lottery draws three digits. If the digits match the players selected number, the player wins, otherwise the player loses. If the player has wagered one dollar, upon winning the player receives a payout of five hundred dollars.
Thus, in the Daily Number there are two possible end states: Win and Lose and the probability of winning is 1/1000 = .001. Since sum of the probabilities of all states must equal one, the probability of losing is 1 - 1/1000 = .999. This is portrayed in the table below.
WIN
LOSE
Probability
.001
.999
There are two basic strategies for apporaching this game: play or don't play. We can calculate a net outcome for each of the strategies in each of the states. If the player bets one dollar and his or her number matches the number draawn then he or she receives five hundred dollars: a net of $499. If the number drawn does not match the player's number then the player loses his or her wager of one dollar. If the player elects not to play, then no money is risked and no money is won in each of the states. This is shown in the table below.
WIN
LOSE
Probability
.001
.999
Play
499
-1
Don't Play
0
0
In classical statistical decision theory, we would represent the variables symbolically:
States:
si
State probabilities:
pi
Actions or Strategies:
aj
Outcomes:
oi, j
For the Daily Number example, the values of the variables are:
States:
s1 = "Win", s2 = "Lose"
State probabilities:
p1 = .001, p2 = .999
Actions or Strategies:
a1 = "Play", a2 = "Don't Play"
Outcomes:
o1, 1 = -$499, o1, 2 = $-1, o2, 1 = 0, o2, 2 = 0
Statistical decision theory states that the best or optimum strategy is the one that produces the highest return on the average. This is found by computing the statistical average or mean, for each alternative strategy. This men is the outcome for the strategy in each state times the probability of the state. Mathematically this is expressed as:
EVj = Σj oi, j*pi
For our Daily Number example the expected values become:
Play -> EV1 = $-499 * .001 + $-1 * .999 = $-.5
Don't Play -> EV2 = 0 * .001 + 0 * .999 = $0
In our matrix representation we would show this as:
WIN
LOSE
Expected Value
Probability
.001
.999
Play
499
-1
-.50
Don't Play
0
0
0
The optimal decision is thus to not play. Every time a player plays, he or she loses fifty cents on the average. Yet every day millions of people play such games. There are several potential reasons for this phenomenon. First, and simplest, is that people don't understand probabilities and the structure of the game. There is a lot of evidence to support this conclusion. Another reason is that we remember or wins and forget our losses and extimate our gains much larger than they actually are. Economists have sugggested other reasons. Players see a value in playing the game itself. It provides a topic for discussion and stimulates the player. Economists also posit that straight dollar amounts should not be used but a concept called "utility". Winning $500 is "worth" more than 500 times losing $1 (i.e. the value function is not linear).
The Lottery has another game of chance called "CASH 5". In this game there are 43 numbers numbered 1 to 43. A player picks five of these numbers. At a drawing, the Lottery randomly selects 5 numbers of the 43. If the numbers selected by the Lottery match your numbers, then you win. Note that there are payoffs for partial matches of numbers, but we are only going to examine the case of a complete match.
The probability that one of your numbers matches a drawn nmber is 5/43. The probability that a second of you numbers matches a drawn number is 4/42. The probability that all five of your numbers match the drawn numbers is:
If the player bets one dollar, the game initially pays $125,000. The decision matrix for this situation is shown below.
WIN
LOSE
Expected Value
Probability
.000001038856
.999998961144
Play
125,000
-1
-0.87014196
Don't Play
0
0
0
CASH 5 is normally a worse bet that the Daily Number, the player loses an average of a little over eighty seven cents per dollar played.
However, CASH 5 is different from the Daily Number in that, if no player wins during any drawing, the jackpot (win outcome) accumulates for the next drawing. Because the winning probability is fixed in the game, there is a value for the winning outcome above which the expected value of playing is positive i.e. it is a good bet.
Exercise
Attached is a spreadsheet with the CASH 5 decision matrix encoded in it. Find the value for payout (winning outcome) where the expected value of playing is positive. You can find the answer by clicking here.
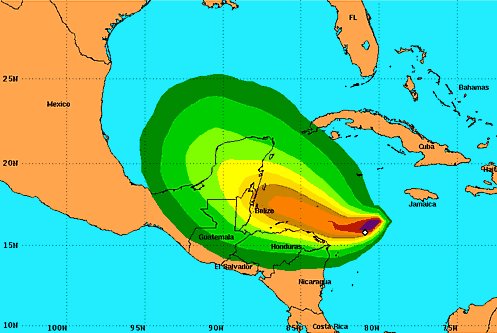
Probabilistic decision models have many applications in emergencies. Consider the case of hurricanes. The map below shows a typical hurricane weather prediction map. The map shows the current location of the hurricane and the forecasts of where the hurricane will go based on its current location and direction. Colors are used to denote the likelihood of the hurricane moving to that point. Note that the closer we are to the current position of the hurricane, the less variance of our prediction.
The following animation shows the progression of predictions for the path of Hurricane Earl from August 27, 2010 to September 3, 2010 made by the National Oceanic and Atmospheric Administration (NOAA). NOAA uses a sophisticated computer model to estimate the path of a hurricane from historical and other factors. Each day's prediction is represented by a triangular shape progressing from the current position of the hurricane. For each pediction, the most likely path is shown by milestone dots in the triangle. Clicking on the button with the arrow advances the display to the next day. (Note: Some browsers attempt to block this animation. Click "temporarily allow blocked content" on the pop-up or change your browser's settings. Also, the animation will click through once. To play it again, click your browser's refresh button.)
An emergency manager can cast the situation of a hurricane landfall as a statistical decision problem. He or she might classify the possible states of interest as a Miss, a Partial Hit or a Direct Hit. The probabilities of these states can be estimated from the hurricane forecasts. The emergency manager might be interested in exploring three alternative strategies: Evacuation, Shelter-in-Place or Do Nothing. Note that the selection of states and strategies is somewhat arbitrary. The emergency manager could just as easily have defined states as Miss, 25% Hit, 50% Hit, 75% Hit and Total Hit. Likewise intermediate strategies (e.g. Partial Evacuation, Voluntary Evacuation, etc) could be employed.
The hard part of the decision problem is estimating the outcomes for a particular strategy and state. Many factors can be taken into account and converted into costs. Costs will generally fall into two classes: damage caused by the hurricane and costs associated with protecting people and assets from dange. Examples of the categories and types of costs to consider are:
Category
Measure
Human
Loss of Life Injury Social Costs Lost Wages
Property
Buildings Vehicles Pets/Livestock Equipment
Emergency
Emergency Support Functions Infrastructure Damage
Recovery
Reconstruction Repair
The table below shows a decision model for a hurricane landfall scenario. For the given probabilities for states of landfall, we can see that the best (lowest cost) strategy is to evacuate.
Miss
Direct Hit
Partial Hit
Expected Value
Probability
.2
.6
.2
Do Nothing
0
6M
5M
4.6M
Shelter
2M
5M
3M
4M
Evacuate
3M
4M
4M
3.8M
A hurricane is a rather dynamic event. It can change direction or strength quickly. The table below shows the same decision model for a hurricane landfall scenario with updated probabilities due to new weather predictions. For the given probabilities for states of landfall, we can see that the best strategy is to shelter-in-place.
Miss
Direct Hit
Partial Hit
Expected Value
Probability
.3
.3
.4
Do Nothing
0
6M
5M
3.8M
Shelter
2M
5M
3M
3.3M
Evacuate
3M
4M
4M
3.7M
Using the decision matrix we can perform scenario or "What if?" analysis. For example in the extreme cases, we can conclude:
If the hurricane misses, the best strategy is to do nothing with a zero expected cost.
If the hurricane is a direct hit, the best strategy is to evacuate with an expected cost of $4 million.
If the hurricane is a partial hit, the best strategy is to shelter-in-place with an expected cost of $3 million.
For each of the strategies, there will be a probability range where that strategy is optimal.
Statistical decision models like these are useful in all phases of emergency preparedness, response, and recovery.
Exercise
The attached spreadsheet has a decision matrix for the hurricane example. Alter the probabilities of Miss, Direct Hit and Partial Hit to discover the points at which each strategy becomes optimal.
Statistical decision models have value in a number of situations. There are a number of cases however where we need a more robust model. The problems with the statistical model include:
Measuring the costs with any precision is difficult.
Many people have moral and ethical concerns about expressing lives in dollars.
The statistical model is essentially a trade-off across dissimilar factors.
The multidimensional decision model avoids some of these problems. The model below shows a multidimensional decision matrix for dealing with a pandemic. The decision variables are: Loss of Life, Injuries, Cost, Work Loss, and Public Opinion. Each of these dimensions has a weight according to its contribution to the decision. Each dimensions is weighted: Important, Average or Unimportant. Each strategy (Do Nothing, Vaccinate, Quarrantine, Treat) is graded as High, Moderate or Low. Note that we could use ranking or some other methodology to value the strategy for each decision factor.
Loss of Life
Injuries
Cost
Work Loss
Public Opinion
Weight
Important
Average
Unimportant
Unimportant
Important
Value
Value
Value
Value
Value
Do Nothing
High
Moderate
Low
High
Low
Vaccinate
Low
High
Low
Moderate
High
Quarrantine
Low
Low
Low
High
High
Treat
Moderate
Moderate
Moderate
Moderate
High
The multiple dimensional decicion matrix lays out the decision problem for us. Rather than using math to arrive at a solution, we use qualitative reasoning to evaluate and compare the strategies. we could apply a threshhold mechanism (e.g. eliminate all strategies where Loss of Life is High) to narrow our alternatives.
Exercise
The attached spreadsheet has a multidimensional decision matrix template. Use the template to explore strategies for dealing with an earthquake.